简体中文
繁體中文
English
Pусский
日本語
ภาษาไทย
Tiếng Việt
Bahasa Indonesia
Español
हिन्दी
Filippiiniläinen
Français
Deutsch
Português
Türkçe
한국어
العربية
How to Use Moving Averages as Dynamic Support and Resistance Levels
Abstract:Moving Average can be use is numerous way, the other way to use moving averages is to use them as dynamic support and resistance levels. It is called dynamic because it’s not like your traditional horizontal support and resistance lines. They are constantly changing depending on recent price action, therefore they are not stable.
Moving Average can be use is numerous way, the other way to use moving averages is to use them as dynamic support and resistance levels.
It is called dynamic because its not like your traditional horizontal support and resistance lines. They are constantly changing depending on recent price action, therefore they are not stable.
There are thousands of forex traders out there who look at these moving averages as key support or resistance. These traders will buy when the price dips and tests the moving average or sell if the price rises and touches the moving average.
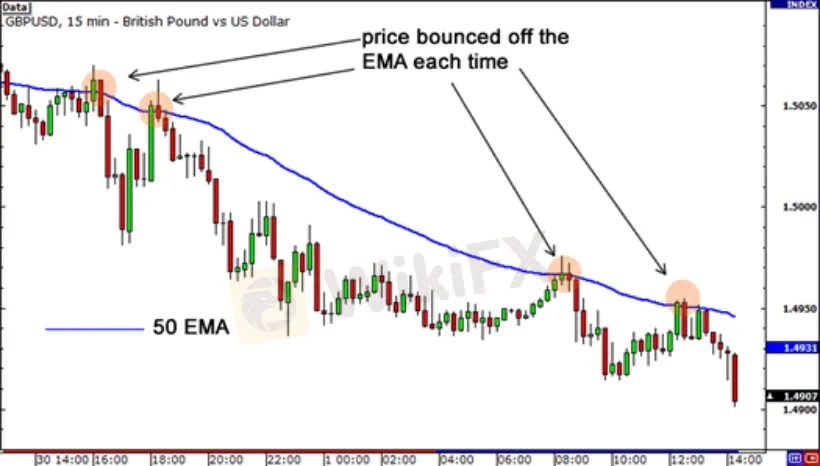
Lets take look at the 15-minute chart of GBP/USD and pop on the 50 EMA. And see if it act as dynamic support or resistance.

It seems like it held really well! Any time price approached 50 EMA and tested it, it served as resistance and the price bounced back down. Surprising, right?
But One thing you should keep in mind is that these are just like your normal support and resistance lines. Which means the price wont always rebound completely from the moving average. Sometimes it will go past it a little bit before heading back in the direction of the trend.
Also there are some times when the price will blast past it altogether. What some forex traders do is that they pop on two moving averages, and only buy or sell once the price is in the middle of the space between the two moving averages. This area can be called “the zone”
Let‘s consider another case of that 15-minute chart of GBP/USD, but this time let’s use the 10 and 20 EMAs.

If you look at the above chart, you see that price moves slightly past the 10 EMA a few pips but proceeded to drop afterward.
There are some traders who use one day strategies just like this.
The essence is that, just like your horizontal support and resistance areas, these moving averages should be treated like zones or areas of interest. The area between moving averages could be considered as a zone of support or resistance.
Breaking through Dynamic Support and Resistance
Now you are aware that moving averages can potentially act as support and resistance. Combining a couple of them, you can have set up yourself a nice little zone. But it is important also to note that they can break, just like any support and resistance level does.
Let‘s take another look at the 50 EMA on GBP/USD’s 15-min chart.

In the chart above, we observe that the 50 EMA held as a strong resistance level for a while as GBP/USD repeatedly rebound off it.
Nevertheless, as weve highlighted with the red box, the price lastly broke through and shot up. And it then retraced and tested the 50 EMA again, which confirmed to be a strong support level. So there you get it!
Another interesting thing about using moving averages is that they‘re always changing, therefore they can act as dynamic support and resistance levels which means that you can just leave it on your chart and don’t have to keep looking back in time to spot potential support and resistance levels. You know that the line most likely represents a moving area of interest. The main problem for sure is figuring out which moving average to use.
Disclaimer:
The views in this article only represent the author's personal views, and do not constitute investment advice on this platform. This platform does not guarantee the accuracy, completeness and timeliness of the information in the article, and will not be liable for any loss caused by the use of or reliance on the information in the article.
Read more

Forex is a game that I enjoy playing
These champions have one thing in common: they not only work their butts off, but they also enjoy what they do.

Wait patiently. Maintain your discipline
"Patience is the key to everything," American comic Arnold H. Glasgow once quipped. The chicken is gotten by hatching the egg rather than crushing it."

There isn't a Holy Grail to be found!
Ask any Wall Street quant (the highly nerdy math and physics PhDs who build complicated algorithmic trading techniques) why there isn't a "holy grail" indicator, approach, or system that generates revenues on a regular basis.

Concentrate on the Process. Profits aren't a priority
We've designed the School of WikiFX as simple and enjoyable as possible to help you learn and comprehend the fundamental tools and best practices used by forex traders all over the world, but keep in mind that a tool or strategy is only as good as the person who uses it.
WikiFX Broker
Currency Calculator


