简体中文
繁體中文
English
Pусский
日本語
ภาษาไทย
Tiếng Việt
Bahasa Indonesia
Español
हिन्दी
Filippiiniläinen
Français
Deutsch
Português
Türkçe
한국어
العربية
What is the Stochastic Indicator and How Do I Use It?
Abstract:The price momentum is measured by stochastics. If you imagine a rocket in the air, it must first slow down before it can turn down. Momentum always moves in the opposite direction of price.
Another technical indicator that traders use to determine where a trend is likely to terminate is the Stochastic oscillator.
The oscillator is based on the following principle:
Prices will remain equal to or above the prior closing price during an uptrend.
Prices will most likely remain equal to or below the prior closing price during a downturn.
George Lane invented this simple momentum oscillator in the late 1950s.
The price momentum is measured by stochastics. If you imagine a rocket in the air, it must first slow down before it can turn down. Momentum always moves in the opposite direction of price.
To predict the continuation of the present direction trend, the Stochastic oscillator utilizes a scale to evaluate the degree of difference between prices from one closing period to the next.
In the same way that the MACD lines are faster than the other, the two lines are similar.

How to Use the Stochastic Indicator in Forex Trading
When the market is overbought or oversold, the Stochastic technical indicator notifies us. The Stochastic is a number that ranges from 0 to 100.
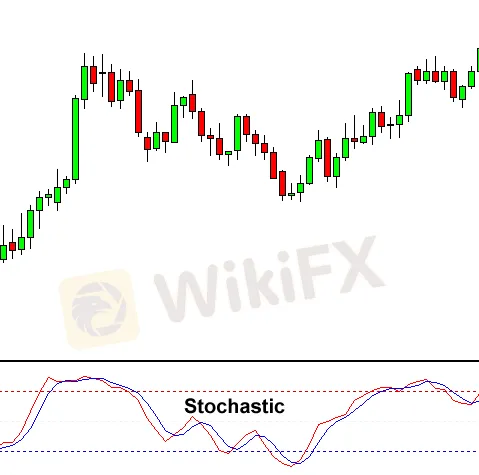
The market is overbought when the Stochastic lines are over 80 (the red dotted line in the chart above).
When the Stochastic lines fall below 20 (the blue dotted line), the market is likely to be oversold.
We purchase when the market is oversold and sell when the market is likely overbought, as a general rule.

If you look at the currency chart above, you can see that the indicator has been overbought for quite some time.
Can you predict where the price will go based on this information?

If you predicted that the price would fall, you were totally correct! A reversal was inevitable because the market had been overbought for such a long time.
The fundamentals of stochastic are as follows.
The Stochastic is used in a variety of ways by forex traders, but the fundamental objective of the indicator is to show us where the market may be overbought or oversold.
Remember that Stochastic can stay above 80 or below 20 for extended periods of time, so just because the indicator shows “overbought” doesn't mean you should sell right away!
Similarly, just because something is “oversold” doesn't imply you should start buying right now!
Be a Stochastic Sheep, not a Stochastic Sheep!

With practice, you'll be able to tailor the Stochastic indicator to your particular trading strategy.
Let's move on to RSI now.
Disclaimer:
The views in this article only represent the author's personal views, and do not constitute investment advice on this platform. This platform does not guarantee the accuracy, completeness and timeliness of the information in the article, and will not be liable for any loss caused by the use of or reliance on the information in the article.
Read more

Forex is a game that I enjoy playing
These champions have one thing in common: they not only work their butts off, but they also enjoy what they do.

Wait patiently. Maintain your discipline
"Patience is the key to everything," American comic Arnold H. Glasgow once quipped. The chicken is gotten by hatching the egg rather than crushing it."

There isn't a Holy Grail to be found!
Ask any Wall Street quant (the highly nerdy math and physics PhDs who build complicated algorithmic trading techniques) why there isn't a "holy grail" indicator, approach, or system that generates revenues on a regular basis.

Concentrate on the Process. Profits aren't a priority
We've designed the School of WikiFX as simple and enjoyable as possible to help you learn and comprehend the fundamental tools and best practices used by forex traders all over the world, but keep in mind that a tool or strategy is only as good as the person who uses it.
WikiFX Broker
Currency Calculator


