简体中文
繁體中文
English
Pусский
日本語
ภาษาไทย
Tiếng Việt
Bahasa Indonesia
Español
हिन्दी
Filippiiniläinen
Français
Deutsch
Português
Türkçe
한국어
العربية
Keltner Channels: How to Use Them
Abstract:Keltner Channels is a volatility indicator created by Chester Keltner, a grain trader, in his 1960 book How To Make Money in Commodities.
Keltner Channels is a volatility indicator created by Chester Keltner, a grain trader, in his 1960 book How To Make Money in Commodities.
Linda Raschke later produced an updated version in the 1980s.
Linda's Keltner Channel, which is more often used, is quite similar to Bollinger Bands in that it also has (3) lines.
In a Keltner Channel, still, the central line is an Exponential Moving Average (EMA), and the two outer lines are calculated using the Average True Range (ATR) rather than standard deviations (SD).
The Keltner Channel contracts and expands with volatility because it is generated from the ATR, which is a volatility indicator in and of itself, but it is not as volatile as the Bollinger bands.
Keltner Channels are used to set trading entry and exit points.
When the trend is flat, the Keltner Channel can help identify overbought and oversold levels relative to a moving average.
It might also provide you hints about emerging trends.
Consider the channel to be an ascending or descending channel, but it adjusts to recent volatility automatically and isn't made up of straight lines.

You may probably infer that Keltner Channels are fashioned from the same cloth as Bollinger Bands if you've read our Bollinger Bands course. That is, almost.
The underlying indicators and calculations that we could go on and on about... but that might lull you to sleep, are what distinguishes these two.
Let's just state that various formulas produce variations in price sensitivity and indication smoothness.
Keltner Channels: How to Trade Forex
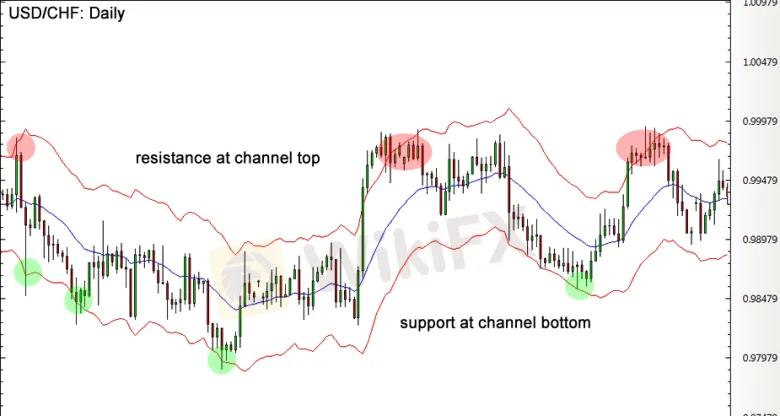
Keltner Channels depict the typical trading range of a currency pair.
Typically, the channel top acts as dynamic resistance, while the channel bottom acts as dynamic support.
Keltner Channels as Dynamic Support and Resistance Levels: How to Use Them
The most popular values for the upper and lower lines are 2 x ATR (10) and EMA (20) for the middle line.
This middle line is crucial because it frequently serves as a pullback level during long-term trends.
The price activity in a UPTREND is confined to the UPPER HALF of the channel, which is located between the middle line as support and the top line as resistance.

Price activity in a DOWNTREND normally stays in the BOTTOM HALF of the channel, with resistance at the middle line and support at the bottom line.

Price swings back and forth between the top and bottom lines in a RANGING MARKET.
Keltner Channels: How to Trade Breakouts
Breakouts from the Keltner Channel provide as strong indicators of where the price is headed next.
If the candles begin to break out above the top, the trend is likely to continue upward.

If the candles begin to close below the BOTTOM, the price will almost always continue to fall.

Keeping a look out for these channel breakouts might assist you in catching a major shift as soon as feasible.
Disclaimer:
The views in this article only represent the author's personal views, and do not constitute investment advice on this platform. This platform does not guarantee the accuracy, completeness and timeliness of the information in the article, and will not be liable for any loss caused by the use of or reliance on the information in the article.
Read more

Forex is a game that I enjoy playing
These champions have one thing in common: they not only work their butts off, but they also enjoy what they do.

Wait patiently. Maintain your discipline
"Patience is the key to everything," American comic Arnold H. Glasgow once quipped. The chicken is gotten by hatching the egg rather than crushing it."

There isn't a Holy Grail to be found!
Ask any Wall Street quant (the highly nerdy math and physics PhDs who build complicated algorithmic trading techniques) why there isn't a "holy grail" indicator, approach, or system that generates revenues on a regular basis.

Concentrate on the Process. Profits aren't a priority
We've designed the School of WikiFX as simple and enjoyable as possible to help you learn and comprehend the fundamental tools and best practices used by forex traders all over the world, but keep in mind that a tool or strategy is only as good as the person who uses it.
WikiFX Broker
Currency Calculator


