简体中文
繁體中文
English
Pусский
日本語
ภาษาไทย
Tiếng Việt
Bahasa Indonesia
Español
हिन्दी
Filippiiniläinen
Français
Deutsch
Português
Türkçe
한국어
العربية
Trading with Multiple Chart Indicators
Abstract:In a real world, we could take just one of these indicators and trade strictly by what that indicator told us.
By now you have understood some of the most common chart indicators and how they works, we can now expose you to some of their examples. So much more important, now let's combine some of these indicators and see how their trade signals pan out.
In a real world, we could take just one of these indicators and trade strictly by what that indicator told us.
But the main problem is that we dont live in a real world, and each of these indicators has deformity. And which is why most traders merge different types of indicators together, so that can permit them to screen each other. The combination might contain 3 different indicators, and they will only trade after all these 3 indicators give them equal signal
Bollinger Bands + Stochastic
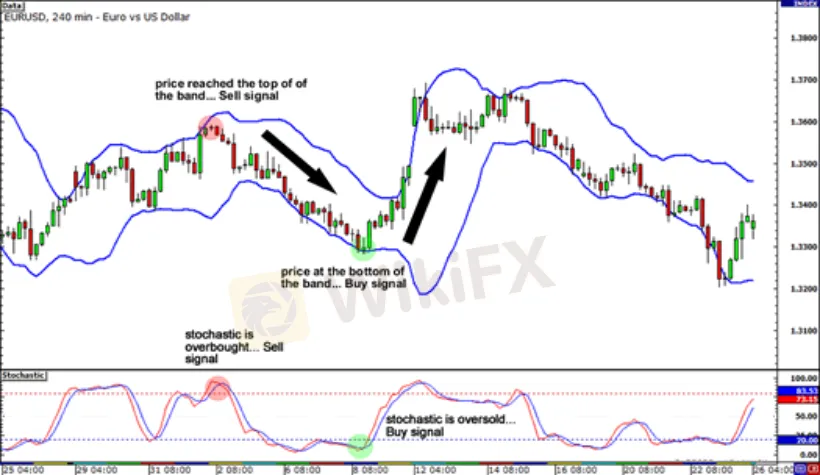
Let's take combination of Bollinger bands and Stochastic on EUR/USD's on 4-hour chart as our first example.
Already the market appears to be ranging or moving sideways, we would better watch out for the Bollinger bounce.

Check out that those sell signals from the Bollinger bands and the Stochastic. EUR/USD climbed until the top of the band, which usually acts as a resistance level. All together, the Stochastic reached the overbought area, recommending that the price could drop down soon. Guess what happened next?
EUR/USD fell by around 300 pips and you wouldve made a heavy profit if you took that short trade. After some time, the price made contact with the bottom of the band, which usually serves as a support level. This means that the pair could rebound up from there. With the Stochastic in the oversold area, it means we should go long. Looking at that trade you notice that you would have gotten around 400 pips! Not bad!
RSI + MACD
Below is another example but this time with the RSI and the MACD.

Just after the RSI reached the overbought area and gave a sell signal, the MACD immediately followed with a downward crossover, which is also a sell signal. And, as you can see, the price did move downhill from there. Cheers to using multiple indicators!
But Later on, the RSI dipped to the oversold region giving a buy signal. A few hours after, the MACD made an upward crossover, which is also a buy signal. From there, the price made a quick climb. With More pips for us
You likely noticed in this example that the RSI gives signals ahead of the MACD. Because of the various properties and magic formulas for the technical indicators, some really do give early signals while others are a bit delayed. You will get to learn more about this in sixth grade.
As you proceed your journey as a trader, you will surely discover which indicators work best for you and gives you good results. From our experience also, we can tell you that we like using MACD, the Stochastic, and RSI, but you might have a different preference that suits your style. Although Every trader out there has tried to find the “magic combination” of indicators that will give them the right signals all the time, but the truth is that there is no such thing.
At these juncture, We therefore urge you to study each indicator on its own until you know the inclination of how it behaves relative to price movement, and then come up with your own combination that you understand clearly and confirm it fits your trading style.
Later on, we will show you an example of a system that merges different indicators to give you an insight of how they can complement each other.
Disclaimer:
The views in this article only represent the author's personal views, and do not constitute investment advice on this platform. This platform does not guarantee the accuracy, completeness and timeliness of the information in the article, and will not be liable for any loss caused by the use of or reliance on the information in the article.
Read more

Forex is a game that I enjoy playing
These champions have one thing in common: they not only work their butts off, but they also enjoy what they do.

Wait patiently. Maintain your discipline
"Patience is the key to everything," American comic Arnold H. Glasgow once quipped. The chicken is gotten by hatching the egg rather than crushing it."

There isn't a Holy Grail to be found!
Ask any Wall Street quant (the highly nerdy math and physics PhDs who build complicated algorithmic trading techniques) why there isn't a "holy grail" indicator, approach, or system that generates revenues on a regular basis.

Concentrate on the Process. Profits aren't a priority
We've designed the School of WikiFX as simple and enjoyable as possible to help you learn and comprehend the fundamental tools and best practices used by forex traders all over the world, but keep in mind that a tool or strategy is only as good as the person who uses it.
WikiFX Broker
Currency Calculator


