简体中文
繁體中文
English
Pусский
日本語
ภาษาไทย
Tiếng Việt
Bahasa Indonesia
Español
हिन्दी
Filippiiniläinen
Français
Deutsch
Português
Türkçe
한국어
العربية
The Head and Shoulders Pattern and How to Trade It
Abstract:A reversal pattern, the head and shoulders chart pattern is most commonly observed in uptrends. "Head and shoulders" is well-known not only for trend reversals, but also for dandruff reversals.
A reversal pattern, the head and shoulders chart pattern is most commonly observed in uptrends.
“Head and shoulders” is well-known not only for trend reversals, but also for dandruff reversals.
We'll talk about trend reversals in this lesson and save the dialogue of dandruff for another time.
Shoulders and Head
A trend reversal formation is a head and shoulders pattern.
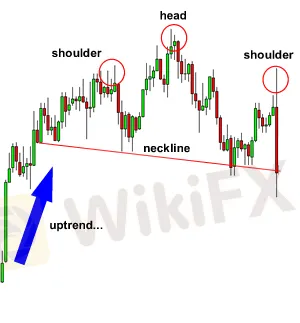
It is made up of a shoulder peak, a higher peak (head), and then another lower peak (shoulder).
The lowest points of the two troughs are joined together to form a “neckline.”
This line's slope can be either up or down. When the slope is lower, the signal is usually more trustworthy.

The head and shoulder pattern is clearly visible in this image.
The pattern's highest point is the head, which is the pattern's second peak. The two shoulders also form the topmost, but they aren't as high as the head.
We put an entry order below the neckline with this configuration.
The high point of the head to the neckline can also be used to calculate a target.
This is the approximate distance that the price will move after breaking through the neckline.

As you can see, the moment the price falls below the neckline, it moves at least the length of the gap between the head and the neckline.
“The price kept moving even after it hit the aim,” we know you're thinking.
“DON'T BE GREEDY!” is our response.
Head and Shoulders in the Opposite Direction
The name is self-explanatory. It's essentially a head and shoulders formation, but turned upside down.
A valley (shoulder) is developed, followed by a lower valley (head), and finally a higher valley (shoulder).
These structures form as a result of prolonged downward movements.

This pattern is similar to a head and shoulders pattern, but it is flipped upside down.
We'd put a long entry order above the neckline with this formation.
Our goal is estimated in the same way that the head and shoulders pattern is.
Measure the distance between your head and your neckline to get an idea of how far the price will move the moment it breaks the neckline.

The price rose nicely the moment it breached the neckline, as you can see.
If your goal is met, you can relax and enjoy your profits.
There are trade management tactics, though, that allow you to lock in some of your profits while keeping your trade open in case the price continues to move in your favor.
Disclaimer:
The views in this article only represent the author's personal views, and do not constitute investment advice on this platform. This platform does not guarantee the accuracy, completeness and timeliness of the information in the article, and will not be liable for any loss caused by the use of or reliance on the information in the article.
Read more

Forex is a game that I enjoy playing
These champions have one thing in common: they not only work their butts off, but they also enjoy what they do.

Wait patiently. Maintain your discipline
"Patience is the key to everything," American comic Arnold H. Glasgow once quipped. The chicken is gotten by hatching the egg rather than crushing it."

There isn't a Holy Grail to be found!
Ask any Wall Street quant (the highly nerdy math and physics PhDs who build complicated algorithmic trading techniques) why there isn't a "holy grail" indicator, approach, or system that generates revenues on a regular basis.

Concentrate on the Process. Profits aren't a priority
We've designed the School of WikiFX as simple and enjoyable as possible to help you learn and comprehend the fundamental tools and best practices used by forex traders all over the world, but keep in mind that a tool or strategy is only as good as the person who uses it.
WikiFX Broker
Currency Calculator


