简体中文
繁體中文
English
Pусский
日本語
ภาษาไทย
Tiếng Việt
Bahasa Indonesia
Español
हिन्दी
Filippiiniläinen
Français
Deutsch
Português
Türkçe
한국어
العربية
Limitations of Heikin Ashi
Abstract:Heikin Ashi, like any other technical analysis tool, is beneficial, but it does have some flaws or limitations.
What are Heikin Ashi's limitations?
Heikin Ashi isn't the holy grail, unfortunately.
Heikin Ashi isn't an Ed Sheeran song in the least. It's far from perfect.
Heikin Ashi, like any other technical analysis tool, is beneficial, but it does have some flaws or limitations.
Let's have a look at what these restrictions are.
True prices are not shown by Heikin Ashi candlesticks.
Heikin Ashi candlesticks are not drawn from actual pricing, unlike traditional Japanese candlesticks.
The Heikin Ashi candlesticks do not designate the actual open and closing prices for a certain time period since they are averaged.
Let's look at an example.
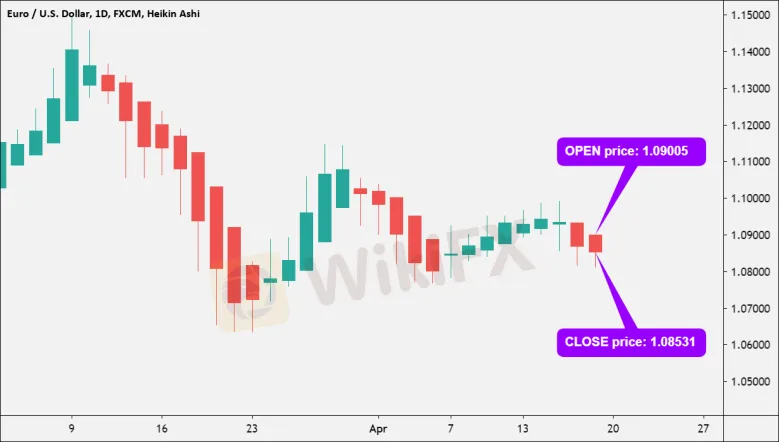
Here's a daily (1D) Heikin Ashi chart of EUR/USD.

Concentrate on the final candlestick. There are a few things to keep in mind:
Red is the color of the candle. That is to say, the candle closed lower than it had opened.
It had an open price of 1.09005.
Its last known price was 1.08531.
Let's take a look at the EUR/USD daily chart using a classic Japanese candlestick chart:

Concentrate on the final candlestick.
There are a few things to keep in mind:
Green is the color of the candle.
This indicates that the candle closed higher than it had opened.
This is the truth. The EUR/USD pair concluded the day with a gain. When compared to Heikin Ashi, which displayed a red candle, this is a significant difference.
It had an open price of 1.08373.
Its last known price was 1.08706.
Let's go through what we just saw:
| Chart Type | Last Candlestick | Open Price | Close Price |
| Heikin Ashi Candlestick | Red | 1.09005 | 1.08531 |
| Traditional Candlestick | Green | 1.08373 | 1.08706 |
Do you see the distinction?
Despite the fact that the “actual” candle closed in the green, Heikin Ashi is still indicating that EUR/USD is in a decline.
Make sure you're aware of the pricing range you're considering.
Because the open and close prices are hidden, some traders choose to use a Heikin Ashi chart as an INDICATOR rather than a price chart.
Actual price information is obscured by Heikin Ashi charts.
This restriction is linked to the previous one.
Although many traders value the closing price, the real closing price is not represented on a Heikin Ashi candlestick.
As a reminder, the Close price is calculated as follows:
(Open+High+Low+Close) / 4 = Close
Only the averaged closing price is displayed.
Make sure you know the exact closing price, not only the averaged figure.
Switching back to a conventional Japanese candlestick chart is a simple way to accomplish this.
For day traders and scalpers, Heikin Ashi charts may not be responsive enough.
A trade setup takes longer to build since the Heikin Ashi candlestick requires price information from two periods.
Longer-term traders, such as swing or position traders, don't face this problem because they have more time to allow their deals develop.
However, for shorter-term traders such as day traders and scalpers, this could be a problem.
Scalpers, for example, require swift price movements and may think that Heikin Ashi charts are insufficiently sensitive for their sort of trading.
Disclaimer:
The views in this article only represent the author's personal views, and do not constitute investment advice on this platform. This platform does not guarantee the accuracy, completeness and timeliness of the information in the article, and will not be liable for any loss caused by the use of or reliance on the information in the article.
Read more

Forex is a game that I enjoy playing
These champions have one thing in common: they not only work their butts off, but they also enjoy what they do.

Wait patiently. Maintain your discipline
"Patience is the key to everything," American comic Arnold H. Glasgow once quipped. The chicken is gotten by hatching the egg rather than crushing it."

There isn't a Holy Grail to be found!
Ask any Wall Street quant (the highly nerdy math and physics PhDs who build complicated algorithmic trading techniques) why there isn't a "holy grail" indicator, approach, or system that generates revenues on a regular basis.

Concentrate on the Process. Profits aren't a priority
We've designed the School of WikiFX as simple and enjoyable as possible to help you learn and comprehend the fundamental tools and best practices used by forex traders all over the world, but keep in mind that a tool or strategy is only as good as the person who uses it.
WikiFX Broker
Currency Calculator


