简体中文
繁體中文
English
Pусский
日本語
ภาษาไทย
Tiếng Việt
Bahasa Indonesia
Español
हिन्दी
Filippiiniläinen
Français
Deutsch
Português
Türkçe
한국어
العربية
What Is The Best Way To Trade Divergences?
Abstract:What Is a Regular Divergence and How Do I Trade It?
In this session, we'll look at some examples of price and oscillator movements diverging.
What Is a Regular Divergence and How Do I Trade It?
Let's start by looking into regular divergence.
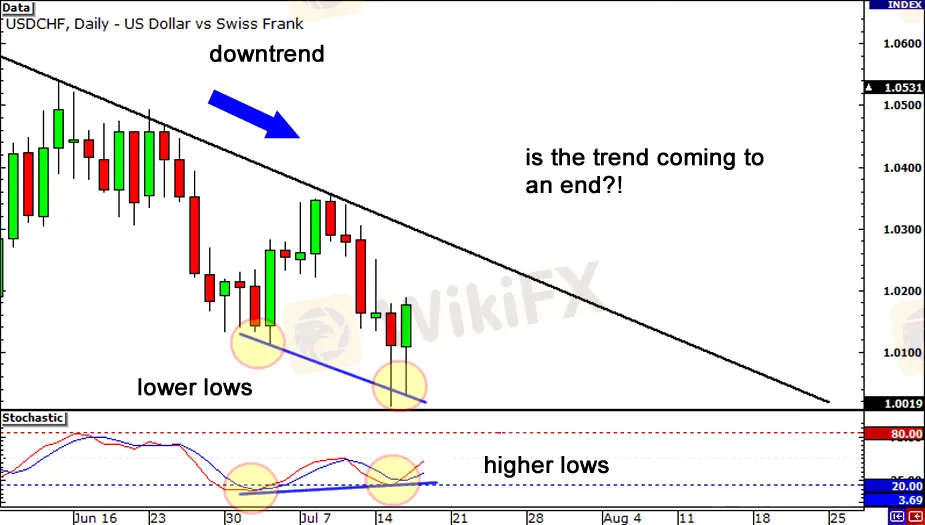
A daily chart of the USD/CHF is shown below.

The dropping trend line shows that USD/CHF has been in a downtrend.
There are indicators, though, that the slump is coming to an end.
While the price has made lower lows, the Stochastic (our preferred indicator) has made a higher low.
There's something fishy about this place.

Is the reversal nearing its end? Is it time to buy this piece of junk?

If you had answered yes to that last question, you would have found yourself in the midst of the Caribbean, sipping margaritas while soaking up your pip wins!
The divergence between the Stochastic and the price action turned out to be an excellent purchase signal.
Price has created a new uptrend after breaking through the declining trend line.
You could have profited almost a thousand pips if you had bought around the bottom, since the pair proceeded to rise in the months afterward.
Can you understand why it's so cool to be one of the first to catch on to a trend?
Did you note the tweezer bottoms that formed on the second low before we moved on?
Other signs of a reversal should be kept a look out for. This will provide additional evidence that a trend is ending, giving you even more cause to believe in the power of divergences!
What Is a Hidden Divergence and How Do I Trade It?
Let's look at an example of some concealed divergence next.
Let's look at the USD/CHF daily chart once again.

The pair has been in a downturn, as can be seen above.
The stochastic is printing greater highs while the price has produced a lower high.
This is a hidden bearish divergence, according to our notes!
What shall we do now? Isn't it time to get back into the swing of things?
If you're not sure, you can always sit back and observe from the sidelines.

If you chose to sit out that one, you may now be as bald as Professor Xavier, since you have ripped out all of your hair.

The pattern has continuing!
The price rebounded off the trend line and fell about 2,000 pips!
Imagine if you had noticed the divergence and interpreted it as a possible signal for the trend to continue.
You'd not only be drinking margaritas in the Caribbean, but you'd also have your very own pimpin' yacht!
Disclaimer:
The views in this article only represent the author's personal views, and do not constitute investment advice on this platform. This platform does not guarantee the accuracy, completeness and timeliness of the information in the article, and will not be liable for any loss caused by the use of or reliance on the information in the article.
Read more

Forex is a game that I enjoy playing
These champions have one thing in common: they not only work their butts off, but they also enjoy what they do.

Wait patiently. Maintain your discipline
"Patience is the key to everything," American comic Arnold H. Glasgow once quipped. The chicken is gotten by hatching the egg rather than crushing it."

There isn't a Holy Grail to be found!
Ask any Wall Street quant (the highly nerdy math and physics PhDs who build complicated algorithmic trading techniques) why there isn't a "holy grail" indicator, approach, or system that generates revenues on a regular basis.

Concentrate on the Process. Profits aren't a priority
We've designed the School of WikiFX as simple and enjoyable as possible to help you learn and comprehend the fundamental tools and best practices used by forex traders all over the world, but keep in mind that a tool or strategy is only as good as the person who uses it.
WikiFX Broker
Currency Calculator


