简体中文
繁體中文
English
Pусский
日本語
ภาษาไทย
Tiếng Việt
Bahasa Indonesia
Español
हिन्दी
Filippiiniläinen
Français
Deutsch
Português
Türkçe
한국어
العربية
Gold Price Plummets, Seeks Technical Support Near May Lows
Abstract:A two-week gold price rally was undone in just two sessions as the precious metal sank from $1,300 to $1,275 after a failed run at key resistance - now it grasps for support.
Gold Price Forecast:
黄金价格预测:
A failed run at the 23.6% Fibonacci level and the $1,300 psychological leveled played a part in driving gold substantially lower in Thursday and Friday trading
23.6%斐波那契水平失败且1,300美元在周四和周五的交易中,心理平衡对推动黄金大幅走低起到了一定的作用
Simultaneously, a series of encouraging trade-war developments crossed the news wires and likely weighed on demand for safety
同时,一系列令人鼓舞的贸易战发展越过新闻线和可能会对安全需求造成压力
Still, retail traders are overwhelming net-long on Gold, find out how to use IG Client Sentiment Data with one of our Live Sentiment Data Walkthroughs
但是,零售交易商仍然在黄金上占据绝对空头,找出如何使用IG客户端情绪数据我们的实时情绪数据演练
Gold Price Plummets, Seeks Technical Support Near May Lows
黄金价格暴跌,寻求近五月低点的技术支撑
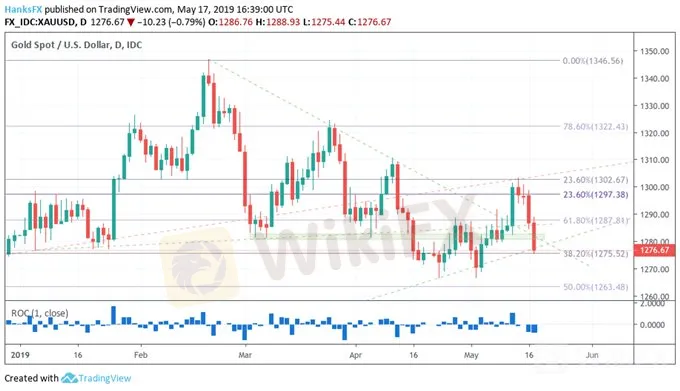
After a failed drive higher in Wednesday trading, gold prices have been battered as the week draws to a close. As forecasted, a series of technical resistance levels combined with the $1,300 psychological level worked in tandem to rebuke a continuation higher. With gold trading to its lowest price since May 3, and on pace for its largest intraday loss since April 16, the metal now grasps for support.
之后周三交易中,由于本周即将收盘,黄金价格受到重创。正如预测的那样,一系列技术阻力水平加上1,300美元的心理水平同时遏制持续走高。随着黄金价格自5月3日以来的最低价格以及自4月16日以来的最大盘中跌幅,金价现在有所支撑。
Gold Price Chart (XAUUSD): Daily Time Frame (January 2019 – May 2019) (Chart 1)
黄金价格走势图(XAUUSD):每日时间表(2019年1月 - 2019年5月)(图1)
{7}

Gold price intraday percentage change in blue
{7}
To that end, the safe-haven asset has some options to work with. First, the 38.2% retracement at $1,275 – counterpart to the 23.6% that stalled Wednesday and Thursdays attempted moves higher – offers immediate support. A close above $1,275 would be an encouraging sign for gold bulls heading into next week. Similarly, an ascending trendline from the August 2018 lows will provide further buoyancy. Although gold prices probed beneath the trendline in early May, a close above in Friday trading would meaningfully bolster the support offered in the $1,275 to $1,278 range.
为此,避险资产有一些可供选择的选择。首先,38.2%的回撤位于1,275美元 - 与周三和周四试图走高的23.6%相反 - 提供了直接支撑。收盘价高于1,275美元将是下周进入黄金多头的一个令人鼓舞的迹象。同样,从2018年8月的低点开始的上升趋势线将提供进一步的浮力。尽管5月初黄金价格在趋势线下方探测,但周五交易收盘价将高于1,275美元至1,278美元区间的支撑位。
However, should selling continue and those levels are rendered obsolete, subsequent support will be offered by the 50% Fib level at $1,263 and prior to that, a modicum of support may be offered at May lows around $1,268. While there is no lack of support, a break beneath the descending trendline originating from February 20, may seek to reassert its dominance over the technical landscape.
但是,如果销售继续并且这些水平已经过时,那么后续支持将由50%斐波那契水平提供,为1,263美元,在此之前,可能会在5月低点1,268美元左右提供一点点支撑。虽然不乏支撑,但从2月20日起的下行趋势线下方突破可能会寻求重申其对技术领域的支配地位。
Gold Price Chart (XAUUSD): 4 - Hour Time Frame (February 2019 – May 2019) (Chart 2)
黄金价格走势图(XAUUSD): 4小时时间范围(2019年2月 - 2019年5月)(图2)

Since February, the trendline has guided gold prices lower, rebuking multiple attempts higher - until golds rally on Monday. The surge corresponded with the largest S&P 500 gap lower since 2009, which was seemingly a sufficient catalyst to drive prices above the trendline. But as the week progressed and trade-war risks have calmed, equities have rebounded, and safe-haven demand has receded.
自2月以来,趋势线引导黄金价格走低,多次尝试高位反弹 - 直到周一金价反弹。这一激增与自2009年以来最大的标准普尔500指数差距相对应,这似乎是推动价格高于趋势线的充分催化剂。但随着一周的进展和贸易战风险的平息,股市已经反弹,避险需求已经消退。
At the same time, the US Dollar has found its footing – surmounting a key trendline of its own - adding to downward pressure on gold. If the fundamental landscape remains stable next week, expect gold to flounder between the different technical levels as traders seek to determine which garners the most respect.
与此同时,美元已经站稳脚跟 - 超越自身的关键趋势线 - 增加黄金的下行压力。如果基本面在下周保持稳定,那么预计黄金将在不同的技术水平之间徘徊,因为交易者寻求确定最受尊重的方面。
Disclaimer:
The views in this article only represent the author's personal views, and do not constitute investment advice on this platform. This platform does not guarantee the accuracy, completeness and timeliness of the information in the article, and will not be liable for any loss caused by the use of or reliance on the information in the article.
Read more

Gold Price Forecast: XAU/USD surges above $1,800 on falling US T-bond yields
Gold advances firmly, as US-10 year T-bond yields drop ten basis points, down to 1.43%. Risk-off market sentiment boosted the prospects of the XAU/USD, as the COVID-19 omicron variant threatens to derail the economic growth. XAU/USD Technical outlook: A break above $1,807 would expose $1,815, followed by $1,834.

Gold Price Forecast: XAU/USD Eyes US Retail Sales for Direction
Gold Forecast - prices look higher after big gain on inflation worries. US retail sales may provide the key for XAU’s direction. XAU/USD eyes psychological 1900 level as prices gain.

Weekly Fundamental Gold Price Forecast: Real Yields to Determine Next Move
Rising inflation expectations and falling long-end bond yields have given a new shine to gold prices. If real yields – nominal yields less inflation – continue to fall, gold prices will likely continue their rally.

Gold Price Forecast: Bullion May Rise Further on Rising Inflation, Breakeven Rates
GOLD, XAU/USD, INFLATION, TREASURY YIELDS, BREAKEVEN RATES– TALKING POINT
WikiFX Broker
Latest News
Brazilian Man Charged in $290 Million Crypto Ponzi Scheme Affecting 126,000 Investors
Become a Full-Time FX Trader in 6 Simple Steps
ATFX Enhances Trading Platform with BlackArrow Integration
IG 2025 Most Comprehensive Review
SEC Drops Coinbase Lawsuit, Signals Crypto Policy Shift
Construction Datuk Director Loses RM26.6 Mil to UVKXE Crypto Scam
Should You Choose Rock-West or Avoid it?
Franklin Templeton Submitted S-1 Filing for Spot Solana ETF to the SEC on February 21
Scam Couple behind NECCORPO Arrested by Thai Authorities
Top Profitable Forex Trading Strategies for New Traders
Currency Calculator


