简体中文
繁體中文
English
Pусский
日本語
ภาษาไทย
Tiếng Việt
Bahasa Indonesia
Español
हिन्दी
Filippiiniläinen
Français
Deutsch
Português
Türkçe
한국어
العربية
Gold Price Targets: XAU/USD Breakout Halted at Trend Resistance
Abstract:Gold prices ripped into multi-year trend resistance this week - the breakout is vulnerable while below. Here are the levels that matter on the XAU/USD weekly chart.
Gold price breakout testing multi-year uptrend resistance– rally vulnerable below 1526
Join Michael for Live Weekly Strategy Webinars on Mondays at 12:30GMT
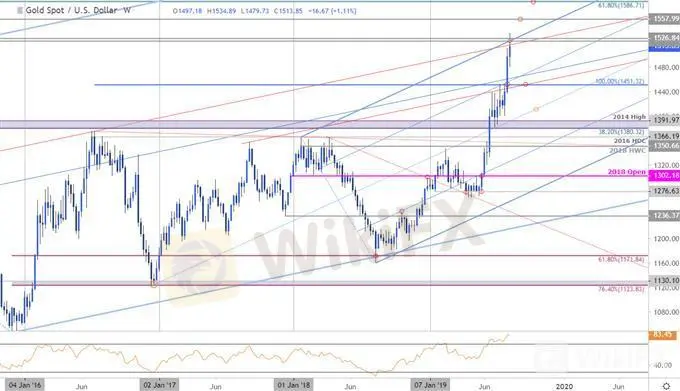
Gold prices are poised to rally for a third consecutive week and would mark the eleventh advance in the past thirteen weeks. The price breakout ran into a critical resistance zone weve been tracking for months now and leaves the broader long-bias vulnerable while below up-trend resistance. These are the updated targets and invalidation levels that matter on the XAU/USD weekly price chart. Review my latestWeekly Strategy Webinar for an in-depth breakdown of this gold price setup and more.
Gold Price Chart - XAU/USD Weekly

Chart Prepared by Michael Boutros, Technical Strategist; Gold on Tradingview
Notes: In my last XAU/USD PriceOutlook we noted that gold was, “testing a critical resistance confluence at 1522/26 and were looking for a reaction up here.” Price briefly registered a high at 1534 before reversing sharply with the focus now on a weekly close in relation to this key threshold. Note that weekly RSI now has momentum at the highest reading since the record 2011 high.
Weekly support remains with the 50% retracement of the decline off the record highs at 1483 backed by key support / medium-term bullish invalidation at 1451. A topside breach exposes subsequent weekly resistance objectives at 1558 and the 61.8% retracement at 1586- look for a bigger reaction there IF reached.
Bottom line: The gold breakout is testing major confluence resistance up here - watch the weekly close. The risk for a near-term pullback / correction mounts if we settle below 1526. From a trading standpoint, a good place to reduce long-exposure / raise protective stops – be on the lookout for possible exhaustion. Ultimately a larger pullback may offer more favorable entries closer to slope support. Review my latest Gold Price Outlook for a closer look at the near-term XAU/USD technical trading levels.
Even the most seasoned traders need a reminder every now and then-Avoid these Mistakes in your trading
Gold Trader Sentiment (XAU/USD)

A summary of IG Client Sentiment shows traders are net-long Gold - the ratio stands at +1.69 (62.9% of traders are long) – bearish reading
Long positions are 3.1% higher than yesterday and 9.6% higher from last week
Short positions are 1.4% higher than yesterday and 8.1% lower from last week
We typically take a contrarian view to crowd sentiment, and the fact traders are net-long suggests Spot Gold prices may continue to fall. Traders are further net-long than yesterday & last week, and the combination of current positioning and recent changes gives us a stronger Spot Gold-bearish contrarian trading bias from a sentiment standpoint.
Disclaimer:
The views in this article only represent the author's personal views, and do not constitute investment advice on this platform. This platform does not guarantee the accuracy, completeness and timeliness of the information in the article, and will not be liable for any loss caused by the use of or reliance on the information in the article.
Read more

Breakthrough again! Gold breaks through $2530 to set a new record high!
Spot gold continued its record-breaking rally as investors gained confidence that the Federal Reserve might cut interest rates in September and gold ETF purchases improved. The U.S. market hit a record high of $2,531.6 per ounce

Historic Moment: Gold Surges Above $2,500 Mark, Forging Glory!
Boosted by the weakening of the US dollar and the expectation of an imminent rate cut by the Federal Reserve, spot gold broke through $2,500/ounce, setting a new record high. It finally closed up 2.08% at $2,507.7/ounce. Spot silver finally closed up 2.31% at $29.02/ounce.

Weekly Analysis: XAU/USD Gold Insights
Gold prices have been highly volatile, trading near record highs due to various economic and geopolitical factors. Last week's weak US employment data, with only 114,000 jobs added and an unexpected rise in the unemployment rate to 4.3%, has increased the likelihood of the Federal Reserve implementing rate cuts, boosting gold's appeal. Tensions in the Middle East further support gold as a safe-haven asset. Technical analysis suggests that gold prices might break above $2,477, potentially reachin

【MACRO Insight】Monetary Policy and Geopolitics - Shaping the Future of Gold and Oil Markets!?
In the ever-evolving global economy, the intertwining influences of monetary policy and geopolitical factors are reshaping the future of the gold and crude oil markets. This spring, the gold market saw a significant uptrend unexpectedly, while Brent crude oil prices displayed surprising stability. These market dynamics not only reflect the complexity of the global economy but also reveal investors' reassessment of various asset classes.
WikiFX Broker
Latest News
$13M Pig Butchering Scam: Three Arrested for Money Laundering
FINMA Opens Bankruptcy Proceedings
FCA Issues Warning Against 14 Unregistered Financial Firms
Crypto Scam Exposed: 3 Arrested for Defrauding Investors
Nifty 50 Index Futures Now Available at Interactive Brokers
Grand Unveiling: The Core Reasons Behind the Yen’s Rise
Ethereum’s Shock Drop: What’s The Real Reason?
Famous Olympic Breakdancer’s Brother Faces Crypto Fraud Charges
Why Hasn’t Binance Listed Pi Network (PI) Yet? Key Reasons Explained
Gold Surge News: Central Banks Expand Gold Reserves—Will Prices Rise?
Currency Calculator


