简体中文
繁體中文
English
Pусский
日本語
ภาษาไทย
Tiếng Việt
Bahasa Indonesia
Español
हिन्दी
Filippiiniläinen
Français
Deutsch
Português
Türkçe
한국어
العربية
NZD/USD Price Analysis: Consolidates in a narrowing price range
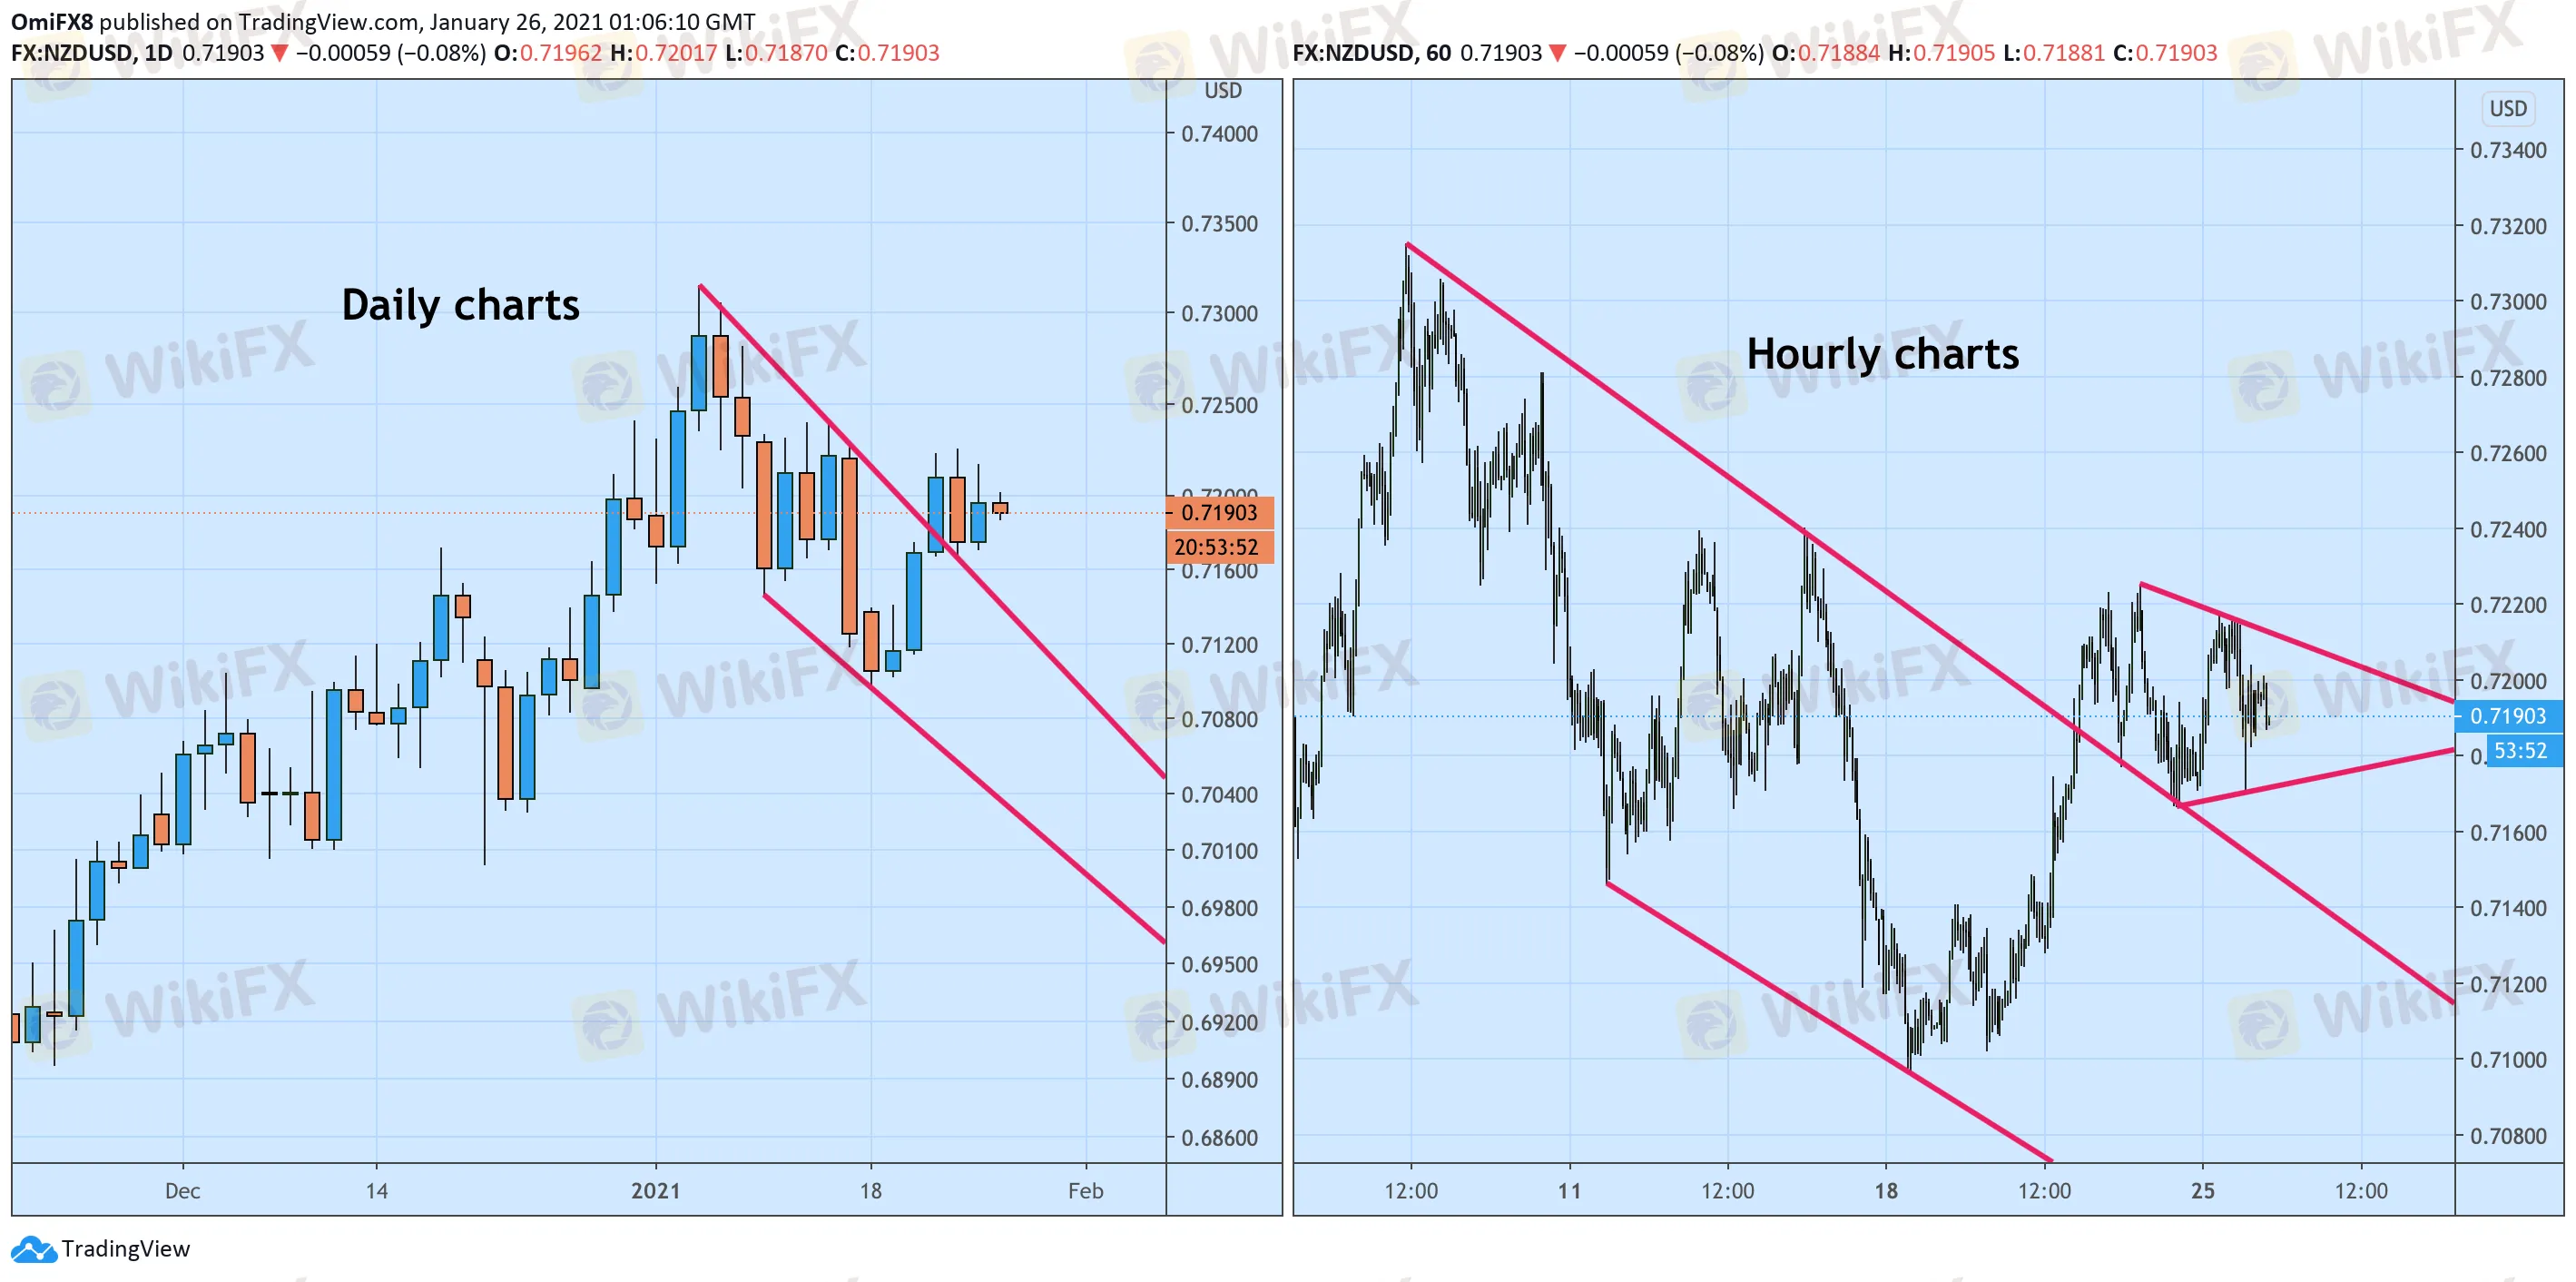
Abstract:NZD/USD's hourly chart shows a contracting triangle pattern. A breakout would validate the bullish pattern seen on the daily chart.
NZD/USD has created a narrowing price range over the past 48 hours or so, marking a weak follow-through to a bullish falling channel breakout confirmed by Thursday's 0.51% gain.
The immediate bias will remain neutral as long as the pair is trapped in the contracting triangle (narrowing price range) seen on the hourly chart. A move above the top end of the triangle, currently at 0.7212, would validate the daily chart falling channel breakout confirmed last week and open the doors for a re-test of the Jan. 6 high of 0.7315.
Alternatively, a range breakdown would shift risk in favor of a drop to the Jan. 18 low of 0.7096.

Disclaimer:
The views in this article only represent the author's personal views, and do not constitute investment advice on this platform. This platform does not guarantee the accuracy, completeness and timeliness of the information in the article, and will not be liable for any loss caused by the use of or reliance on the information in the article.
WikiFX Broker
Latest News
Brazilian Man Charged in $290 Million Crypto Ponzi Scheme Affecting 126,000 Investors
Become a Full-Time FX Trader in 6 Simple Steps
ATFX Enhances Trading Platform with BlackArrow Integration
Decade-Long FX Scheme Unravels: Victims Lose Over RM48 Mil
What Can Expert Advisors Offer and Risk in Forex Trading?
5 Steps to Empower Investors' Trading
How to Find the Perfect Broker for Your Trading Journey?
The Top 5 Hidden Dangers of AI in Forex and Crypto Trading
The Most Effective Technical Indicators for Forex Trading
Indian National Scams Rs. 600 Crore with Fake Crypto Website
Currency Calculator


