简体中文
繁體中文
English
Pусский
日本語
ภาษาไทย
Tiếng Việt
Bahasa Indonesia
Español
हिन्दी
Filippiiniläinen
Français
Deutsch
Português
Türkçe
한국어
العربية
Various Applications of the ZigZag Indicator
Abstract:Various Applications of the ZigZag Indicator

This article provides several different useful applications for the ZigZag trading indicator. Find out which are the best settings to use for this indicator in the MetaTrader 4 trading platform, and follow step-by-step tutorials that will guide you through each scenario. Discover all of that and much more!
The ZigZag indicator is a very diverse indicator that allows for huge versatility in both trading and analysis. We can use the MetaTrader 4 ZigZag indicator for:
Spotting tops and bottoms
Entry points
Fibonacci tools
Harmonic patterns
Channels and patterns
Multiple ZigZag charting
Wolfe Waves
MetaTrader Supreme Edition Keltner Channels
The ZigZag indicator utilises sectional lines to connect significant tops and bottoms of the price. The minimum price change parameter determines the percentage for the price to move to create a new zig or zag. This indicator eliminates price changes that are less than the given value of this parameter. Hence, the ZigZag indicator highlights significant changes only. In most cases, we use the ZigZag indicator to indicate only the most important turns and changes; applying other indicators (i.e. Elliot Waves) can provide a more holistic view.
ZigZag Indicator MT4 SettingsThe ZigZag indicator tracks and connects extreme points of the chart, the distance between these points being equal to or higher than the percentage specified for the price scale. To use the ZigZag indicator, a percentage of price movements must be set. Although the default value for a ZigZag deviation is 5, a setting of 10 would ensure that only price fluctuations of 10% or more would be shown in the chart.
This eliminates smaller price swings, and allows the analyst to see the bigger picture. Normally, the closing prices of Forex currency pairs are used, and imaginary points are placed on the given chart where the price reverses by the set percentages. These points are then connected by straight lines (red by default) and the ZigZag appears.

Source: MetaTrader 4 - ZigZag Indicator Properties
The default settings are shown in the screenshot above. 'Depth' is the first setting of the ZigZag indicator. This is the minimum number of bars with no second maximum or minimum deviation from the bar. Deviation is the number of pips or points (depending on the market) after the previous minimum or maximum is formed.
Backstep is the last setting and reflects the minimum amount of bars between which the high and low can be plotted. These settings should be adapted to various financial markets, and you will probably end up using different settings for one market or instrument versus another. Additionally, you could also end up changing the settings for the same market or indicator when the market conditions change along with its volatility.
Spotting Tops and BottomsThe ZigZag indicator can identify tops and bottoms depending on the input settings used. Traders should be able to identify higher highs, higher lows, lower highs, and lower lows just by looking at the indicator lines as shown in the example within the graph below. This allows for an easier assessment of a trend.

Depicted: MetaTrader 4 - EUR/USD H4
Price EntriesOnce a temporary low or high is identified, a trader might opt to enter a trade based on the trend patterns, such as the 1-2-3 pattern. The 1-2-3 pattern is the bottom, a correction, a retest, and a rebound. The pattern usually occurs at the end of trends and swings (i.e. an indication of a change in trend). They can also be found within a trading range, taking place when the directional momentum of a trend is diminishing. By using the ZigZag indicator, you should be able to identify it easily.

Depicted: MetaTrader 4 - EUR/USD H4
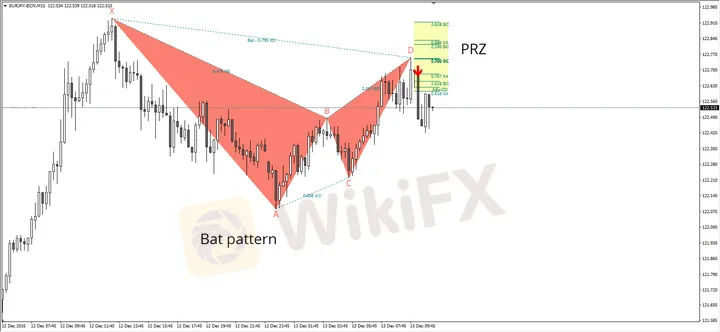
Harmonic PatternsIn the two examples given below, we can see how the ZigZag indicator helps traders to find ratios for using harmonic patterns. However, a common issue with using the ZigZag indicator to chart harmonic patterns is that the the last leg of the harmonic pattern might repaint.
AB=CD Pattern
The AB=CD pattern is a four-point price structure in which the initial price segment is partially retraced and followed by an equidistant move from the completion of the pullback. In classic AB=CD, the BC is a retracement of 61.8%–78.6% of AB, with CD being the extension leg of 127.2% to 161.8% (equal in price distance). In a AB=CD extension, CD leg is an extension of AB between 127.2%–161.8%. The ABCD and the BAT pattern use the ZigZag indicator to plot the pattern on the chart.

Depicted: MetaTrader 4 - GBP/USD M5

Depicted: MetaTrader 4 - EUR/JPY M15
ZigZag and Fibonacci ToolsMany custom indicators use the ZigZag indicator to plot Fibonacci levels. Zigzags are usually considered corrective waves, or three-waves structures. Considering the wave structure of Fibonacci, the concept is that Fibonacci levels will have a higher chance of being respected depending on the most likely wave count at the time.
The two go hand in hand and reinforce each other very neatly. Obviously, you can use the Fibs as well with the ZigZag waves when applying them on a candle or a natural swing and it could work perfectly fine. This is an example of how the custom-made Fibonacci indicator uses a default MT4 ZigZag indicator showing Fibonacci levels, arcs, and time zones.

Depicted: MetaTrader 4 - EUR/USD H1
ZigZag Channels and PatternsThe ZigZag indicator is also used within different channel indicators. Due to its nature, when you combine all of the above-mentioned things, you should have most of the critical information when using the ZigZag indicator with channels. When used for channel drawing, the ZigZag indicator should be able to filter out smaller price movement for you, and you should be able to ignore the noise and see the bigger picture.

Depicted: MetaTrader 4 - EUR/USD H1
Additionally, the ZigZag indicator is able to show different chart patterns, such as the head and the shoulder; W, M, V-shaped reversals; and many others. That can really be an advantage to beginner traders who still don't know how to define patterns with the naked eye.

Depicted: MetaTrader 4 - EUR/USD D1
Multiple ZigZags on the ChartAnother way to use this indicator is to have several ZigZag indicators plotted on your chart by applying multiple deviation parameters. The idea behind such a ZigZag setup is that when a smaller deviation of the indicator is inverse of the larger deviation, that could be a trigger to make your trade in the direction of the larger deviation ZigZag indicator.
See the example below! The blue ZigZag line represents the main trend and the deviation is set to 36, while the red line represents smaller retracements after which the entries were made. The deviation is set to 6. This is just a theory, but its practical usage can be tested further.

Depicted: MetaTrader 4 - EUR/USD H1 -
Wolfe WavesWolfe Waves are a naturally occurring trading pattern present in all financial markets. Originally discovered by an S&P500 trader named Bill Wolfe, Wolfe Waves work a bit like Elliot Waves. Albeit there are some differences in charting techniques, as this pattern is composed of five waves showing supply and demand towards an equilibrium price. Wolfe Waves usually develop on all time frames, and are used to predict where the price is heading, and when it might get there.

Depicted: MetaTrader 4 - EUR/USD H1
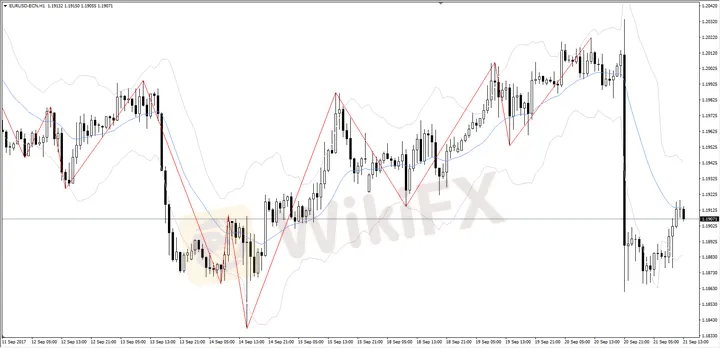
MetaTrader 4 Supreme Edition Keltner ChannelsThere are a lot of Keltner Channel indicators openly available in the market, and MetaTrader 4 Supreme Edition offers an elite range. However, with testing various Keltner Channel indicators, it has been acknowledged that there are a lot of different versions of the indicator itself. The idea behind this mini strategy is to sell when the price goes above the channel, and to buy when the price goes below the channel. In both cases, entries should be confirmed with a ZigZag.

Depicted: MetaTrader 4 - EUR/USD H1
ConclusionThe ZigZag may appear to some traders to be the Holy Grail of trading, but you have to remember that the last leg (wave) of the ZigZag might extend as it follows the price. It is called 're-painting', but it is standard considering the nature of the indicator. Use the indicator to monitor the health of the primary trend, and use it with all the important tools mentioned above. It can be of a great help to traders who actively trade the Forex market and other financial markets.
Disclaimer:
The views in this article only represent the author's personal views, and do not constitute investment advice on this platform. This platform does not guarantee the accuracy, completeness and timeliness of the information in the article, and will not be liable for any loss caused by the use of or reliance on the information in the article.
Read more

Easy Trading Online Awarded “Best Forex Broker - Asia” at Wiki Finance EXPO 2024 Hong Kong
We are thrilled to announce that Easy Trading Online has been awarded the “Best Forex Broker - Asia” at the Wiki Finance EXPO 2024 Hong Kong! This prestigious recognition underscores our commitment to excellence and dedication to providing top-notch services to our clients.

Celebrating Excellence of Easy Trading Online at 2024 FastBull Awards Ceremony
On the evening of April 28, Easy Trading Online proudly received the 'Most Trusted Forex Broker' award at the BrokersView 2024, hosted by Fastbull. This accolade is a testament to our steadfast dedication to providing reliable and superior trading services in the forex and CFD brokerage industry.

Easy Trading Online Shines as Gold Sponsor at BrokersView Expo Dubai 2024
The BrokersView Expo Dubai 2024 is a premier event in the financial industry, bringing together top financial institutions, brokers, and technology providers from around the globe. As the Gold Sponsor of BrokersView Expo Dubai 2024, Easy Trading Online took the opportunity to showcase our latest products, service technologies, and core competitive advantages in the forex trading field.

Easy Trading Online at the Wiki Gala Night
On the 23rd of March, the Easy Trading Online family had the distinguished pleasure of being the Table Sponsor at the prestigious Wiki Gala Night. As we reflect on the event, it’s with a sense of pride and joy that we share the highlights and our takeaways from an evening that was as inspiring as it was splendid.
WikiFX Broker
Latest News
The Withdrawal Trap: How Scam Brokers Lure Victims into Paying More
FCA to Investors: Think Twice Before Trusting These Brokers
Trump\s tariffs: How could they affect the UK and your money
Trump gambles it all on global tariffs he\s wanted for decades
TradingView Brings Live Market Charts to Telegram Users with New Mini App
Trump tariffs: How will India navigate a world on the brink of a trade war?
IG Group Acquires Freetrade for £160M to Expand UK Investment Market
U.S. March ISM Manufacturing PMI Released
Should You Beware of Forex Trading Gurus?
Exposed by SC: The Latest Investment Scams Targeting Malaysian Investors
Currency Calculator


