简体中文
繁體中文
English
Pусский
日本語
ภาษาไทย
Tiếng Việt
Bahasa Indonesia
Español
हिन्दी
Filippiiniläinen
Français
Deutsch
Português
Türkçe
한국어
العربية
MATIC Price Prediction: Polygon bulls kickstart 34% upswing
Abstract:An uptick in bullish sentiment could see Polygon reach the upper boundary of the governing technical pattern at $2.32.

MATIC price could be preparing for a major rally if buying pressure increases.
A key technical indicator suggests that MATIC has recently formed a local bottom.
MATIC price has recently formed a local bottom according to a key technical indicator, suggesting that Polygon is ready for a bullish reversal. The token could tag the upper boundary of the governing technical pattern at $2.32 next if it slices above crucial resistance levels.
MATIC price forms local bottom
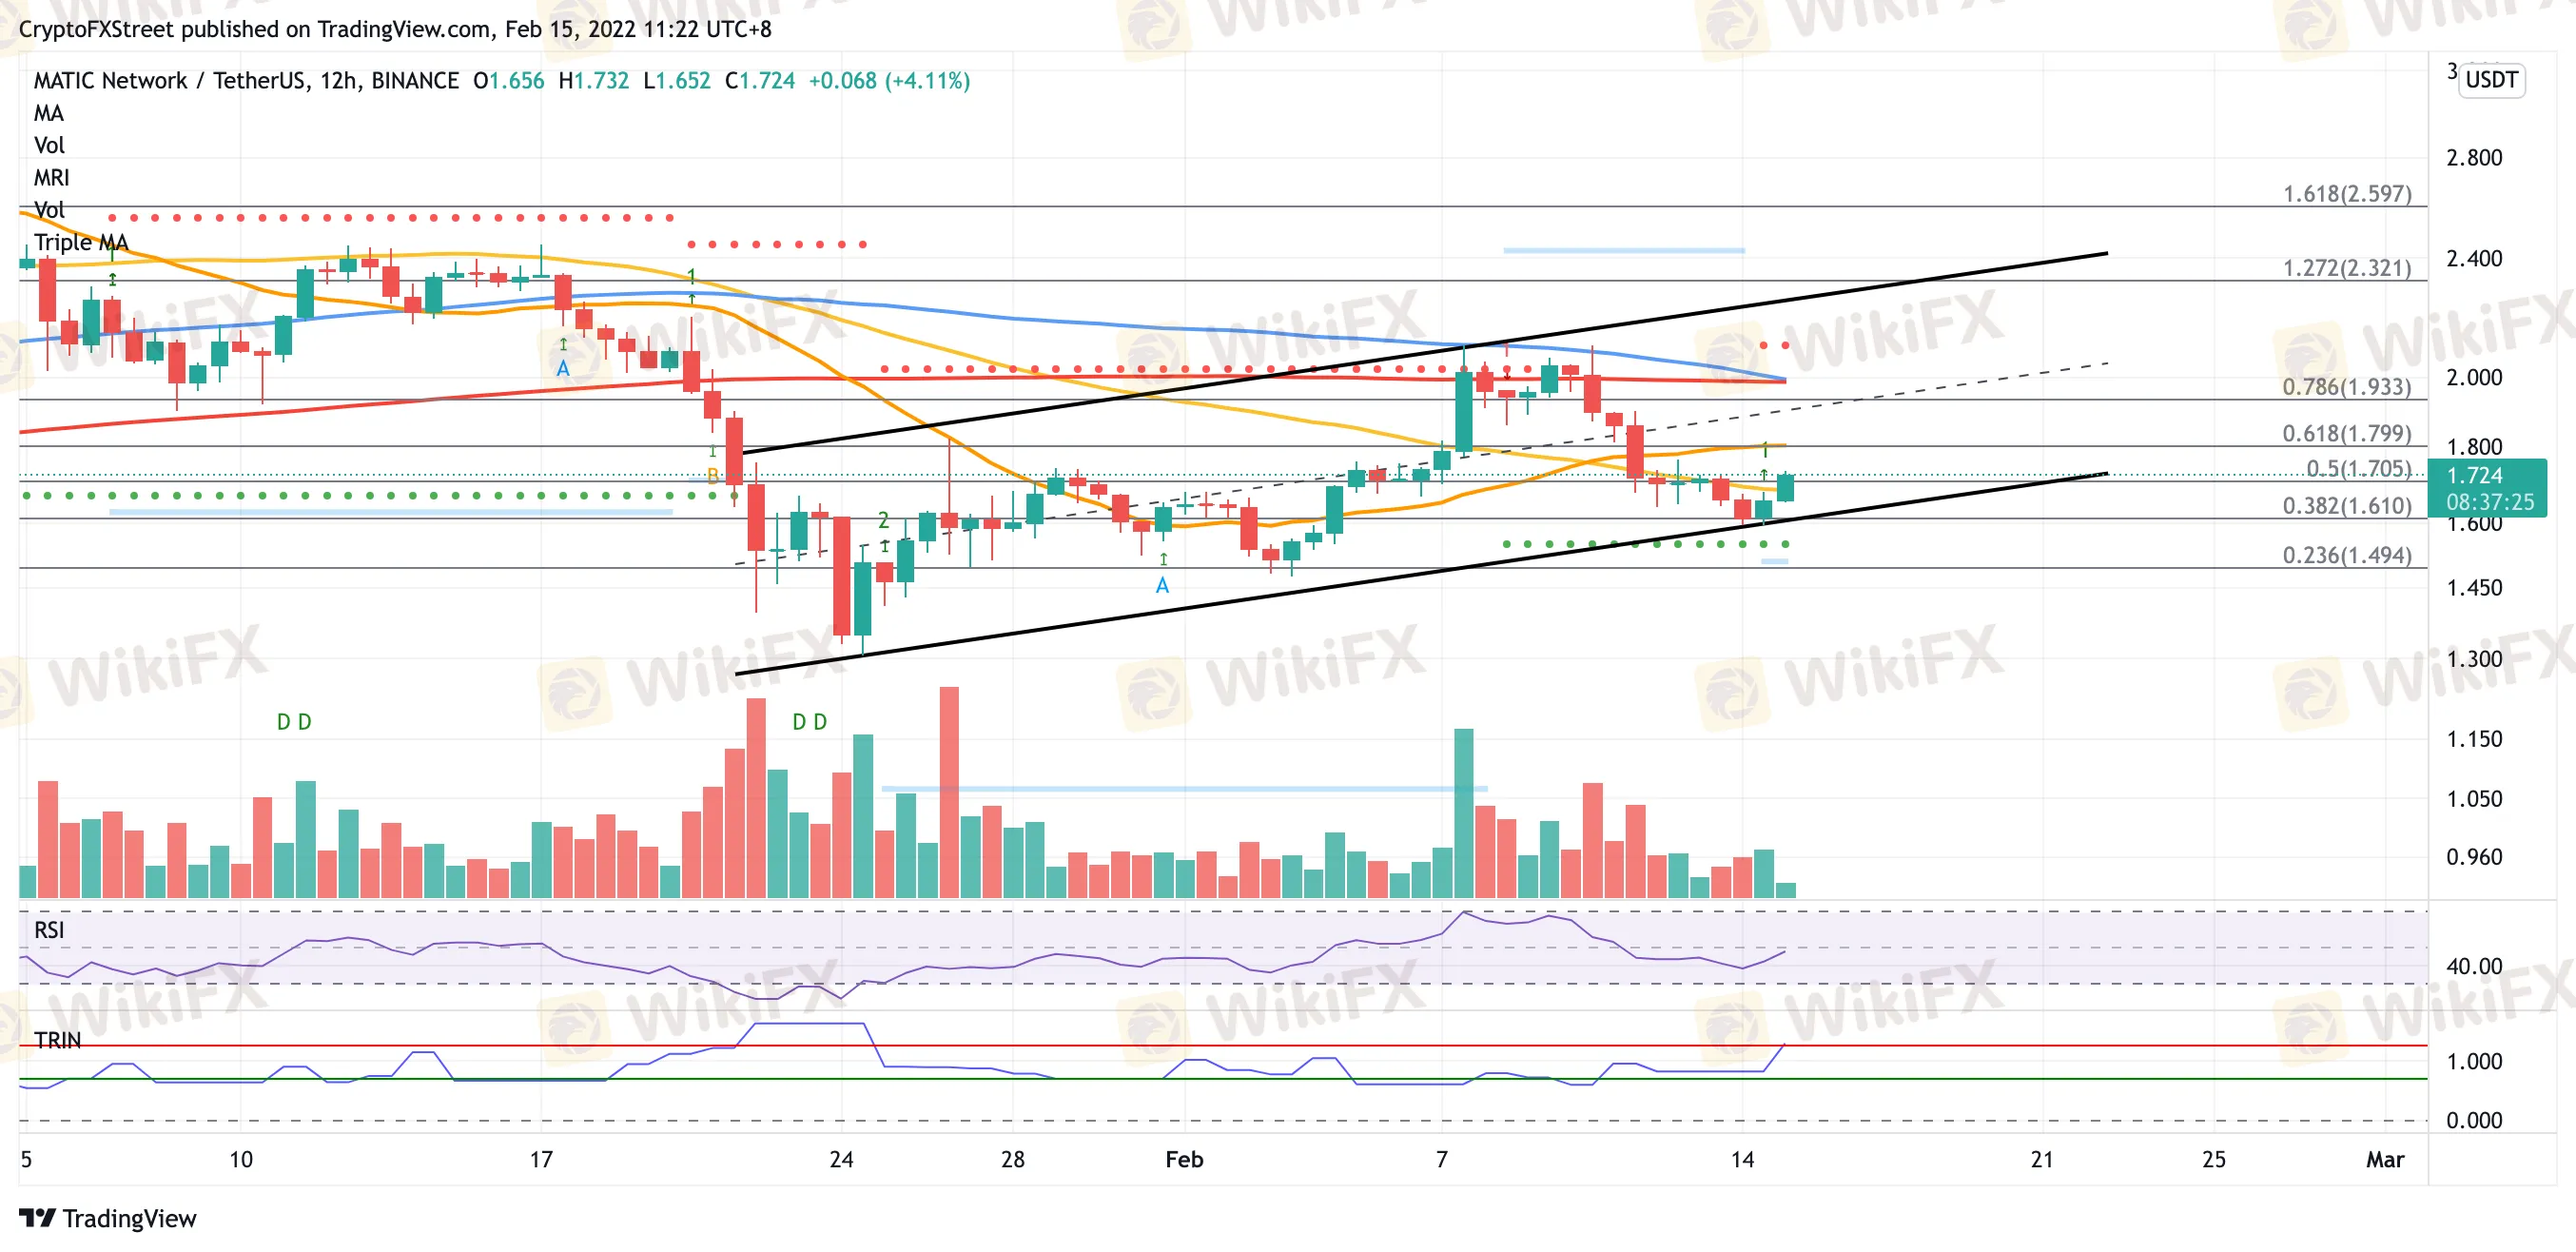
MATIC price has formed an ascending parallel channel on the 12-hour chart, projecting a bullish outlook. Polygon could target the upper boundary of the prevailing chart pattern at $2.32 next, coinciding with the 127.2% Fibonacci extension level.
Polygon has tagged the lower boundary of the governing technical pattern at $1.59 as support on February 14. At the same time, while MATIC price reached the swing low, the Momentum Reversal Indicator (MRI) has flashed a bottom signal, suggesting the token is preparing for a reversal.
MATIC price will face immediate resistance at the 21 twelve-hour Simple Moving Average (SMA) at $1.79, intersecting with the 61.8% Fibonacci retracement level. Additional hurdles may emerge at the middle boundary of the governing technical pattern at $1.93, coinciding with the 78.6% Fibonacci retracement level.
Polygon will face additional headwinds at $2.00, where the 100 twelve-hour SMA and the 200 twelve-hour SMA intersect, then at the resistance line given by the MRI at $2.10. Only if MATIC price manages to overcome the aforementioned challenges would see the token reach the optimistic target at $2.32.

Disclaimer:
The views in this article only represent the author's personal views, and do not constitute investment advice on this platform. This platform does not guarantee the accuracy, completeness and timeliness of the information in the article, and will not be liable for any loss caused by the use of or reliance on the information in the article.
Read more

Blockchain Decentralization: Empowering a Trustless Future
In recent years, blockchain technology has rapidly evolved from a niche innovation behind Bitcoin into a transformative force across industries. At its core, blockchain decentralization refers to the distribution of authority and decision-making away from a central entity and into the hands of a distributed network of participants. This shift redefines how data is stored and verified and paves the way for trustless, transparent, and resilient systems that challenge traditional centralized models.

The president of @Liberland, @Vít Jedlička come on stage, dialogue on trading security.
The 2025 WikiEXPO Hong Kong Station is about to grandly open. the president of @Liberland, @Vít Jedlička come on stage, dialogue on trading security.

Countdown: 1 day.WikiEXPO2025's first stop, Hong Kong, is about to open.
⏰ Countdown: 1 day. WikiEXPO2025's first stop, Hong Kong, is just tomorrow. Focus on transaction security and explore new investment opportunities. ???? Get ready to start now. See you tomorrow.

JustForex vs JustMarkets: A Comprehensive Comparison in 2025
Selecting the right forex broker can make the difference between trading success and frustration for most investors, especially retail investors. As retail traders gain unprecedented access to global markets, the choice between platforms like JustForex and JustMarkets becomes increasingly significant. Both brokers offer some shining features within the forex and CFD trading space, but their approaches differ in some areas.
WikiFX Broker
Latest News
INFINOX Partners with Acelerador Racing for Porsche Cup Brazil 2025
The Dark Side of Trading Gurus: Are You Following a Fraud?
Currency Calculator


