简体中文
繁體中文
English
Pусский
日本語
ภาษาไทย
Tiếng Việt
Bahasa Indonesia
Español
हिन्दी
Filippiiniläinen
Français
Deutsch
Português
Türkçe
한국어
العربية
Gold Price Forecast: XAU/USD hovers around $1,900, eyes on Russia's expected bombardment
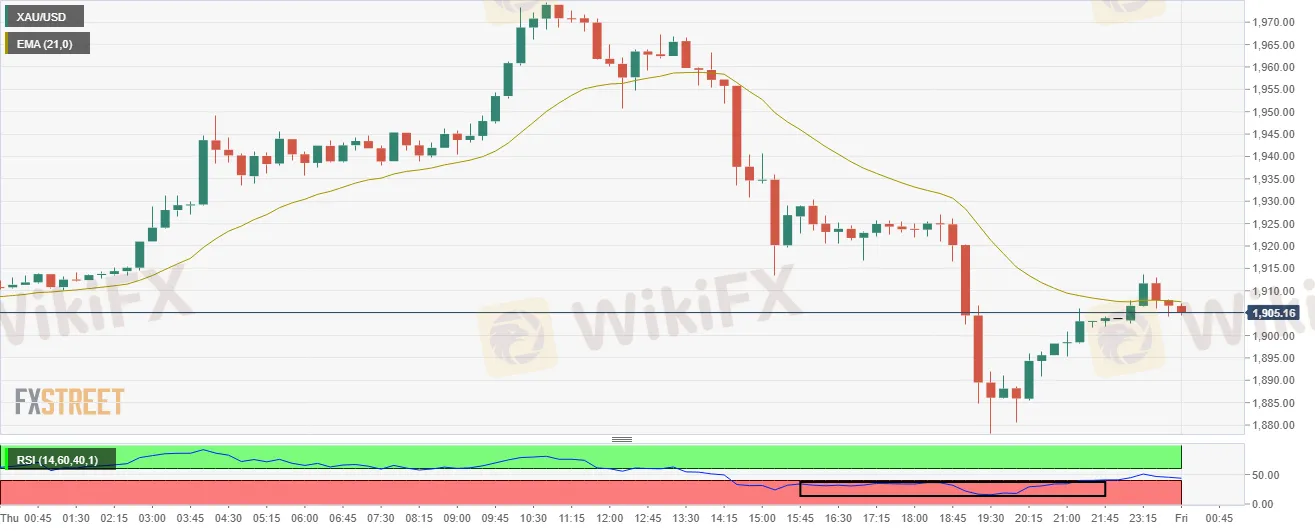
Abstract:Gold price is hovering near $1,900, off from Friday‘s low at $1,878.10 after falling on its face from Thursday’s high of $1,974.48. The precious metal has regained some strength and moving higher but is likely to sense selling pressure near $1,915 levels.

Gold price retreats from $1878.10 but may find offers near $1,913 as investors risk appetite expands.
The expectations of an aggressive monetary policy have underpinned the greenback against gold.
Inflation to soar further amid rising crude oil prices, Russia's expected bombardment of Kyiv eyed.
On Thursday, the precious metal nosedived with much more acceleration than it showed while scaling higher. It seems that the third law of motion kicked in and the yellow metal fell like there is no other day.
Despite the fact that the risk-off impulse is still intact owing to the negative developments in the Russia-Ukraine war, the investors have underpinned the greenback against the precious metal. The rationale behind the fall in the gold prices can be tagged to the rising bets over an aggressive tightening policy by the Federal Reserve (Fed) post the Russia-Ukraine crisis. The unstoppable crude oil prices are set to move the prices of finished goods higher. Expectations of soaring inflation in an already high inflation market may force to central banks to adopt some strict measures to contain the situation.
Apart from the aggressive tightening monetary policy, improvement in the US GDP numbers and slippage in the weekly Initial Jobless Claims have hammered the gold prices. The US GDP numbers have improved to 7% while the Initial Jobless Claims have reduced to 232K against the previous print of 249K.
The US dollar index (DXY) continues to remain rangebound post the sanctions announcement by the US on Russia in response to its military action on eastern Ukraine. Meanwhile, the benchmark 10-year US Treasury yields are trading at 1.97%
Gold Technical Analysis
On an intraday scale, XAU/USD is sensing selling pressure near the 21-period Exponential Moving Average (EMA), which is trading around $1,908. The Relative Strength Index (RSI) (14) has shifted its trading range from 20.00-40.00 to 40.00-50.00, which indicates a consolidation ahead.
Gold 15-min chart

Disclaimer:
The views in this article only represent the author's personal views, and do not constitute investment advice on this platform. This platform does not guarantee the accuracy, completeness and timeliness of the information in the article, and will not be liable for any loss caused by the use of or reliance on the information in the article.
Read more

Blockchain Decentralization: Empowering a Trustless Future
In recent years, blockchain technology has rapidly evolved from a niche innovation behind Bitcoin into a transformative force across industries. At its core, blockchain decentralization refers to the distribution of authority and decision-making away from a central entity and into the hands of a distributed network of participants. This shift redefines how data is stored and verified and paves the way for trustless, transparent, and resilient systems that challenge traditional centralized models.

The president of @Liberland, @Vít Jedlička come on stage, dialogue on trading security.
The 2025 WikiEXPO Hong Kong Station is about to grandly open. the president of @Liberland, @Vít Jedlička come on stage, dialogue on trading security.

Countdown: 1 day.WikiEXPO2025's first stop, Hong Kong, is about to open.
⏰ Countdown: 1 day. WikiEXPO2025's first stop, Hong Kong, is just tomorrow. Focus on transaction security and explore new investment opportunities. ???? Get ready to start now. See you tomorrow.

JustForex vs JustMarkets: A Comprehensive Comparison in 2025
Selecting the right forex broker can make the difference between trading success and frustration for most investors, especially retail investors. As retail traders gain unprecedented access to global markets, the choice between platforms like JustForex and JustMarkets becomes increasingly significant. Both brokers offer some shining features within the forex and CFD trading space, but their approaches differ in some areas.
WikiFX Broker
Latest News
Exposing the Top 5 Scam Brokers of March 2025: A Closer Look by WikiFX
Gold Prices Climb Again – Have Investors Seized the Opportunity?
Webull Launches SMSF Investment Platform with Zero Fees
Australian Regulator Warns of Money Laundering and Fraud Risks in Crypto ATMs
The Withdrawal Trap: How Scam Brokers Lure Victims into Paying More
FCA to Investors: Think Twice Before Trusting These Brokers
Trump\s tariffs: How could they affect the UK and your money
Trump gambles it all on global tariffs he\s wanted for decades
TradingView Brings Live Market Charts to Telegram Users with New Mini App
HTFX Spreads Joy During Eid Charity Event in Jakarta
Currency Calculator


