简体中文
繁體中文
English
Pусский
日本語
ภาษาไทย
Tiếng Việt
Bahasa Indonesia
Español
हिन्दी
Filippiiniläinen
Français
Deutsch
Português
Türkçe
한국어
العربية
Abstract:How can you track duration across assets and is the duration sell-off over?
Duration is a KEY-word for everything in the world of investments. All asset classes hold an embedded duration (zero for some, practically eternal for others) and all equities carry a very clear duration risk profile.
What is duration then? In plain words the duration profile depicts the amount of years until the weighted average of expected cash flows are received by the investor in an asset. That calculation is straight forward for a zero-coupon bond as you simply receive the cash-flow when the bond matures, meaning that a 10yr zero coupon bond has a maturity of 10 years. It is a trickier to calculate for coupon bonds (duration < maturity profile) and even worse to estimate for equities as it is a guessing game to calculate the fixed cash-flow of a stock in to the future. No one ultimately knows, why cash-flow based duration measures for stocks tend to become guestimates.
The best way to measure equity duration is via the empirical sensitivity to a 1% change in the long-term return that the stock is priced to deliver. If the perpetual bond yield rises by 1%-point, while the expected return of the stock remains unchanged, then the modified duration will give you an estimate of the price sensitivity of the stock in percent to that move in bond yields.
If a stock is expected to deliver a lot of returns in a far distant future (I am looking at you Cathie Woods), then the duration will be high and vice versa for stocks that pay dividends today with low or no expectations for return growth.
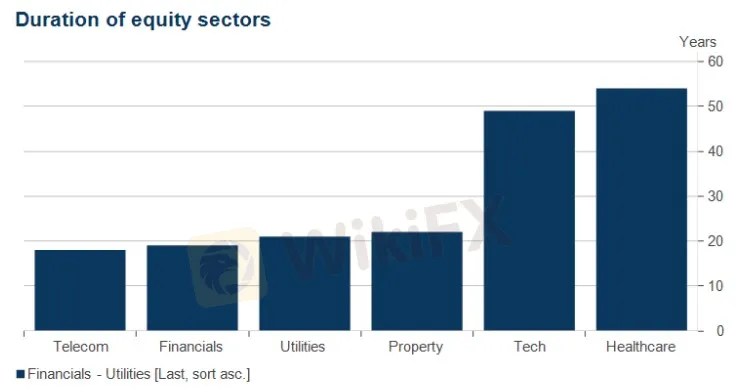
Chart 1. Estimated modified duration of various equity sectors
The above heatmap is also a good representation of stock-sectors which have proven vulnerable through the most recent repricing of duration risks in financial markets. Duration has suffered through 2021 and 2022 as the long end of the yield curve started re-pricing higher already when growth re-bounded post the first round of Covid lockdowns.
The lesson learned is that duration intensive assets (such as tech, innovative healthcare, and long bonds) suffer already while central banks are repriced and not necessarily when the hiking cycle commences. The far end of the yield curve simply rebounds much earlier than the short end, which is the exact pattern that we have now observed again. Only over the past 6 months, the short-end has started playing catch-up at lightning speed.
One of the assets with the most extreme duration profile is the 100yr bond issued by Austria in 2017. The bond rose from index 100 in 2017 to almost index 240 in late 2020 alongside the “low for longer” interest rate environment that followed on the back of material easing through the first round of Covid lockdowns. Since mid-to-late 2020, the Austrian bond has been halved in value again as the repricing of the terminal rate and the long-term policy rate outlook has led the far-end of the yield curve higher again. And they told us that Bonds are not risky ???? … And remember that this 50% drawdown in a duration intensive bond happened before any whatsoever rate hike from the ECB…
Chart 2. From index 100 to 240 and back again for the 100yr bond in Austria. Wow, just wow!
The Federal Reserve is now fully repriced, at least if you ask me. The Fed Funds policy rate is priced to reach >3% by December-23, before rate cuts are being priced in again during 2024. The neutral rate (the policy rate, which is neutral to the economy) is likely lower than 3%, which means that the Fed deliberately tries to take some steam out of the economy if they bring the policy rate above 3%. The good news for duration assets is that the Fed is already priced to hike to >3% territory, which is the main reason why we have seen a sell-off in all assets with an intensive duration profile over the past 12-15 months.
Chart 3. The Fed is now priced to hike to levels above 3% by Dec-2023
For duration to keep underperforming, we would hence need expectations for the Fed policy rate to rally even further above 3.5%. Call me millennial, call me naïve, call me gullible. I don‘t mind. I simply don’t find >3.5% territory for the Fed Funds feasible as the hiking cycle peaked at 2.25-2.50% in 2018/2019 and fundamentals have worsened since. Debt loads are much higher, demographics have weakened, and the labour force is smaller, which suggest that the neutral rate is lower, not higher, than in 2018/2019.
I hence remain of the view that duration intensive assets are starting to look attractive again from a risk/reward perspective. That means buying equities with a high expected growth rate (those to the right in chart 1) and it means buying long bonds, but so far I have been proven wrong on that view over the past month or two.
Remember that I disliked duration big time through 2021 (due to the repricing of central banks), but the duration profile is repriced already way before a hiking cycle actually commences and usually to a much smaller extent while the hiking cycle is actually ongoing.
Best of luck to all of you!
Disclaimer:
The views in this article only represent the author's personal views, and do not constitute investment advice on this platform. This platform does not guarantee the accuracy, completeness and timeliness of the information in the article, and will not be liable for any loss caused by the use of or reliance on the information in the article.
Robinhood to introduce options trading in the UK by 2025 following FCA approval. Discover how this expansion aligns with Robinhood's strategy for global growth and new features.
In recent months, PrimeX Capital, a Forex and CFD broker established in 2022, has become a subject of concern in the trading community. However, despite these enticing features, the broker's reputation has been severely tarnished by multiple complaints and a troubling lack of regulatory oversight.
Markets4you, is a global forex broker launched in 2007. It was established in the British Virgin Islands. This broker offers its global traders various market instruments.
Discover how MultiBank Group, a global leader in financial derivatives, secured three prestigious awards at Traders Fair Hong Kong 2024, highlighting its innovative trading solutions and industry excellence.