简体中文
繁體中文
English
Pусский
日本語
ภาษาไทย
Tiếng Việt
Bahasa Indonesia
Español
हिन्दी
Filippiiniläinen
Français
Deutsch
Português
Türkçe
한국어
العربية
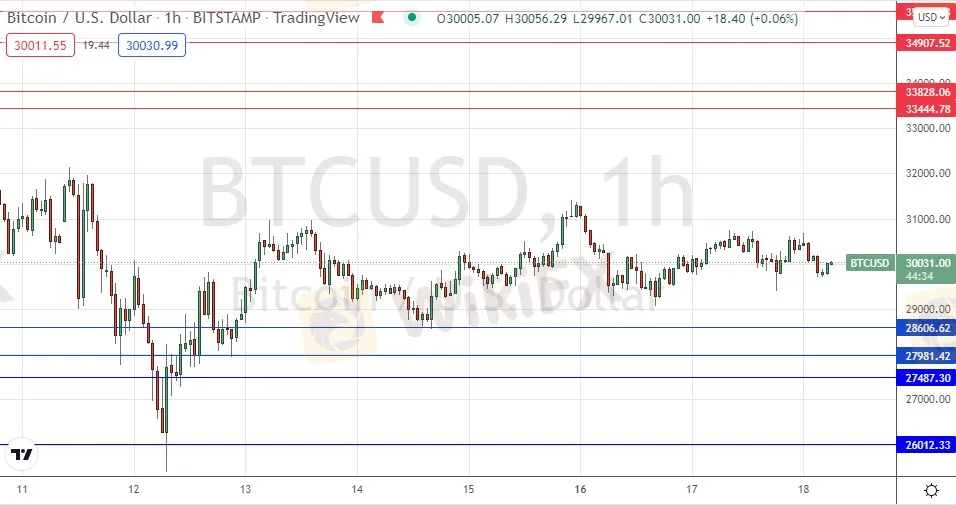
BTC/USD Forex Signal: Consolidation Above $28,607
Abstract:The price has room to rise to $33,445. Previous BTC/USD Signal My signal yesterday was not triggered, as none of the key support or resistance levels were reached. Today’s BTC/USD Signals Risk 0.50% per trade. Trades must be entered before 5pm Tokyo time Thursday.
The price has room to rise to $33,445.
Previous BTC/USD Signal
My signal yesterday was not triggered, as none of the key support or resistance levels were reached.
Todays BTC/USD Signals
Risk 0.50% per trade.
Trades must be entered before 5pm Tokyo time Thursday.

Long Trade Ideas
Long entry after a bullish price action reversal on the H1 timeframe following the next touch of $28,607, $27,981, or $27,487.
Place the stop loss $100 below the local swing low.
Adjust the stop loss to break even once the trade is $100 in profit by price.
Take off 50% of the position as profit when the trade is $100 in profit by price and leave the remainder of the position to run.
Short Trade Ideas
Short entry after a bearish price action reversal on the H1 timeframe following the next touch of $33,445 or $33,828.
Place the stop loss $100 above the local swing high.
Adjust the stop loss to break even once the trade is $100 in profit by price.
Take off 50% of the position as profit when the trade is $100 in profit by price and leave the remainder of the position to run.
The best method to identify a classic “price action reversal” is for an hourly candle to close, such as a pin bar, a doji, an outside or even just an engulfing candle with a higher close. You can exploit these levels or zones by watching the price action that occurs at the given levels.
BTC/USD Analysis
I wrote yesterday that I saw Bitcoins recovery from the price area below $28,607 as technically significant.
I thought that if the support level at $28,607 did not break down, the next likely price movement for Bitcoin was upwards to the next resistance level at $33,445.
The price has not advanced significantly yet but continues to consolidate within its obvious short to medium-term range above $28,607.
If this nearby support level at $28,607 holds, I think the line of least resistance will be upwards, so I still expect an upwards price movement to happen as the next major directional move.
If the price does fall and get established below $28,607 that would be a bearish sign and could signal the start of a much stronger fall in the price. However, this is much less likely to happen after the price recovered from a drop into that price area last week.
I remain happy to take a long trade here if we get a retracement to $28,607 and a bullish bounce off that level.
Disclaimer:
The views in this article only represent the author's personal views, and do not constitute investment advice on this platform. This platform does not guarantee the accuracy, completeness and timeliness of the information in the article, and will not be liable for any loss caused by the use of or reliance on the information in the article.
WikiFX Broker
Latest News
Is $CORONA Memecoin a Legit Crypto Investment?
Is Pi Network the Next Big Crypto Opportunity?
Donald Trump’s Pro-Crypto Push Boosts PH Markets
Japan’s Shift in Crypto Policy and What It Means for Investors
Is Linkbex a Scam? SFC Warns of Virtual Asset Fraud in Hong Kong
5 Best Copy Trading Brokers: You Can Trust in 2025
3 EXCLUSIVE Ramadan Offers That Won’t Last Long! ACT NOW
The Next Crypto Giants: 5 Altcoins to Watch
Forex Trading: Scam or Real Opportunity?
The Hidden Tactics Brokers Use to Block Your Withdrawals
Currency Calculator


