简体中文
繁體中文
English
Pусский
日本語
ภาษาไทย
Tiếng Việt
Bahasa Indonesia
Español
हिन्दी
Filippiiniläinen
Français
Deutsch
Português
Türkçe
한국어
العربية
WIKIFX report: Stock market indices 101
Abstract:Global stock market indices serve as reliable economic indicators for both the world's economies and those of individual nations. The three indexes that investors and the media in the United States pay the most attention to are the S&P 500, Dow Jones Industrial Average, and Nasdaq Composite. The U.S. equities market is made up of around 5,000 different indices in addition to these three.

Stock market indexes around the world are powerful indicators for global and country-specific economies. In the United States the S&P 500, Dow Jones Industrial Average, and Nasdaq Composite are the three most broadly followed indexes by both the media and investors. In addition to these three indexes, there are approximately 5,000 others that make up the U.S. equity market
In short, a stock market index is a group of stocks that are combined by sector, industry, or economy. Some indices are made of top-ranked companies in the market, while others may consist of handpicked companies from a particular stock market category.
With so many indexes, the U.S. market has a wide range of methodologies and categorizations that can serve a broad range of purposes. By compiling stock information of companies, stock indices allow you to get insights into the overall trend of price movements, market sentiment and general financial health of a market.
Now let's go through to see how they work....
How are stock market indices calculated?How are stock market indices calculated?
The index is calculated by tracking prices of selected stocks (e.g., the top 30, as measured by prices of the largest companies, or top 50 oil-sector stocks) and based on pre-defined weighted average criteria (e.g., price-weighted, market-cap weighted, etc.)
There are several considerations when selecting which stocks will be included in a particular stock index. This could include the size of the company, its market capitalisation, or even its industry.
The moment the companies is selected, the next step is to determine how much weight each of them will have in the index, as the weight of each stock may influence the index value.
Below are the most popular ways indices are weighted:
Market-capitalisation-weighted indicesMarket-capitalisation-weighted indices
In this index type, stocks with a larger market capitalisation carry more weight. A company's market capitalisation can be calculated by multiplying its current stock price by the number of outstanding stocks. For instance, if a company has 1 million stocks selling at USD30, this companys stocks would have a market capitalisation of USD30 million. This company would have much more weight compared to a company with a market cap of USD1 million.
In this case, the price of the index will change drastically as the price of the stock with a higher market cap changes. On the other hand, if a company with a low market cap experiences any change, it would have minimal effect on the stock index.
This is the most common index weighting, and most major stock indices use it to calculate their value.
Equal-weighted indices
An equal-weighted index is where stocks are weighed against each other equally, regardless of their price, market capitalisation, or any other factor. This means that every company‘s performance affects the index equally. Thus, to find the index's price made of 100 stocks, you’d need to add up all their prices and divide the sum by 100.
Price-weighted indices
The weight of each company in a price-weighted index is determined by its current stock price. Regardless of their size, companies with more expensive stocks would have a heavier weight in the index than those with a lower price. For instance, if the stock index consists of four stocks worth USD10, USD20, USD30 and USD40, the stocks would make up 10%, 20%, 30%, and 40% of the total index, respectively.
Its important to note that each index can have multiple variations. For example, the S&P 500 index, tracking the performance of 500 large companies in the US, is usually market-capitalisation-weighted, but there is also an equal-weighted version of it.
How do stock market indices help traders?
Stock indices mainly function as economic indicators or market barometers that measure financial health. The average value of stocks in a specific countrys stock market shows how well its economy is doing.
By observing these indices, you get a sense of how the overall market is doing without monitoring individual stocks, and you can evaluate the performance of the market by comparing the current price of an index to its previous price. This allows traders to analyse market trends and understand market sentiment.
Not only that, traders can also opt to trade on these indices.
Popular stock market indices on Deriv
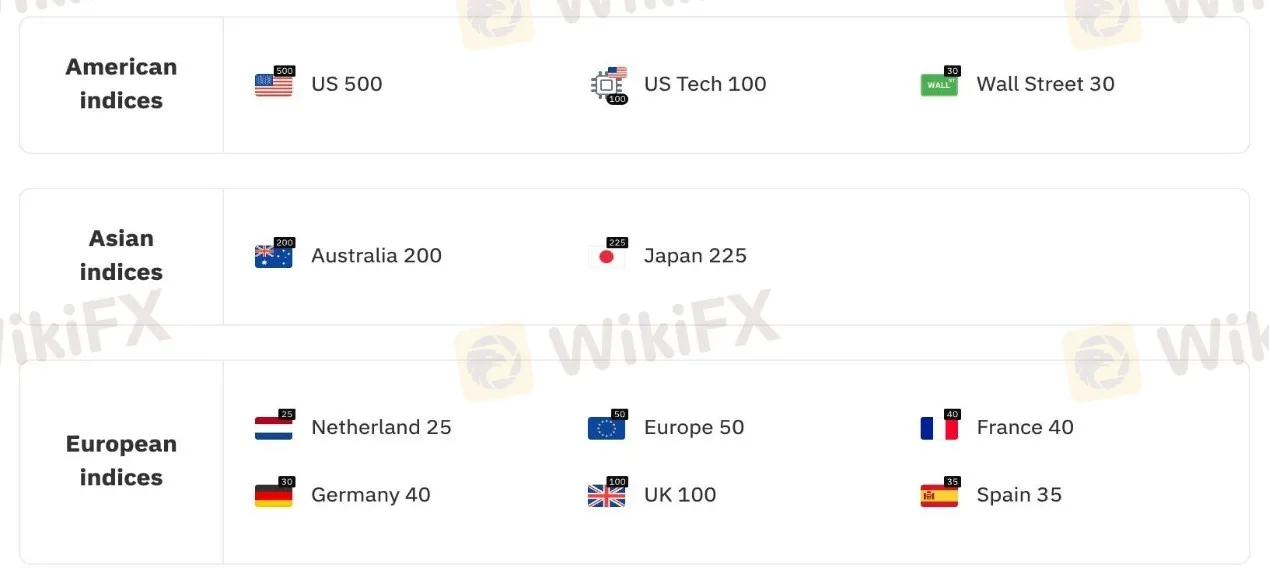
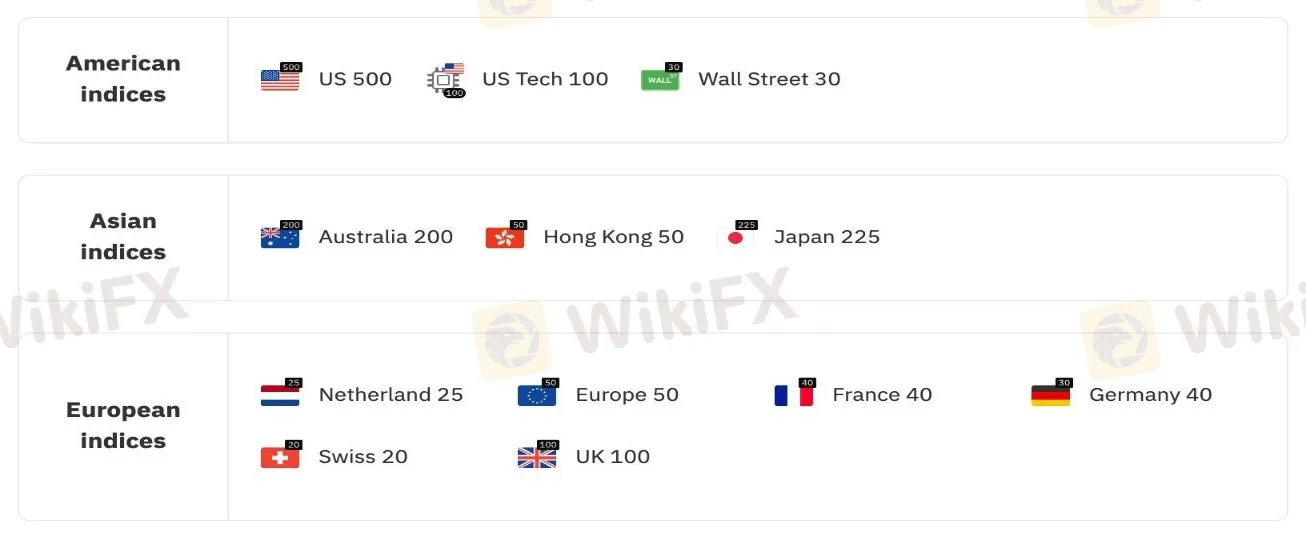
On Deriv, you can trade on popular stock indices with CFDs and options by predicting the indices market movement and without buying the underlying stocks. We offer a handful of popular indices that can be traded on our platforms: American indices, Asian indices, and European indices.
American indices
US 500 is the index of the 500 leading publicly-traded companies in the United States, US Tech 100 features the major technology and non-financial companies, and Wall Street 30 measures the stock movement of the top 30 companies in the United States that conduct industrial activities.

Asian indices
Australia 200 provides the index of the countrys 200 most significant companies, while Japan 225 tracks the stock movement of the top 225 publicly-traded companies in Japan. Hong Kong 50 observes the performance of the 50 largest companies in Hong Kong.

European indices
Europe 50 index looks at the 50 biggest companies in the Eurozone (European Union countries that use the Euro as their currency). France 40 gauges the French stock market movement by considering its 40 best companies. Germany 40 comprises 40 of the country's top performers while Netherlands 25 evaluates the top 25 Dutch companies.
UK 100 analyses the top 100 publicly-traded companies in the United Kingdom. Spain 35 tracks the 35 most prominent Spanish companies, whereas Swiss 20 provides the index of Switzerland's top 20 companies.
Stock market indices available for CFD trading on the Deriv MT5 platform:
DBot and DTrader offer options trading on the following stock indices:
Practise trading on your favourite stock indices with our free demo account, which comes with 10,000 USD virtual funds can be reset when you run out. Once youre ready, you can begin your stock indices trading journey with us.
Disclaimer:
The views in this article only represent the author's personal views, and do not constitute investment advice on this platform. This platform does not guarantee the accuracy, completeness and timeliness of the information in the article, and will not be liable for any loss caused by the use of or reliance on the information in the article.
Read more

Interactive Brokers Expands Crypto Trading with Solana, XRP, Cardano, and Dogecoin
Interactive Brokers adds Solana, XRP, Cardano, and Dogecoin to its platform, enabling U.S. and U.K. clients to trade crypto 24/7 with low fees.

Fidelity Investments Explores Stablecoin Innovation in Digital Assets Sector
Fidelity Investments tests a stablecoin, joining major financial firms in the booming crypto sector. Discover how this impacts digital payments and blockchain adoption.

Hantec Markets Launches InsightPro: AI-Powered Real-Time Trading Signal Tool for Traders
Hantec Markets introduces InsightPro, an AI-powered trading tool offering real-time market insights, signals, and analysis for better trading success.

When High Returns Go Wrong: How a Finance Manager Lost RM364,000
A finance manager in Malaysia lost more than RM364,000 after falling victim to an online investment scam that promised quick and high returns.
WikiFX Broker
Latest News
Enlighten Securities Penalized $5 Million as SFC Uncovers Risk Control Failures
Why Are Financial Firms Adopting Stablecoins to Enhance Services and Stability?
Experienced Forex Traders Usually Do This Before Making a Lot of Money
Octa vs XM:Face-Off: A Detailed Comparison
When High Returns Go Wrong: How a Finance Manager Lost RM364,000
Bridging Trust, Exploring Best—WikiEXPO Hong Kong 2025 Wraps Up Spectacularly
Interactive Brokers Expands Crypto Trading with Solana, XRP, Cardano, and Dogecoin
Fidelity Investments Explores Stablecoin Innovation in Digital Assets Sector
Why More People Are Trading Online Today?
SEC Ends Crypto.com Probe, No Action Taken by Regulator
Currency Calculator


