简体中文
繁體中文
English
Pусский
日本語
ภาษาไทย
Tiếng Việt
Bahasa Indonesia
Español
हिन्दी
Filippiiniläinen
Français
Deutsch
Português
Türkçe
한국어
العربية
Analysis: Major Currency Pairs EUR/USD, GBP/USD, USD/CAD, USD/JPY
Abstract:The USD has subsequently dropped to a new five-month bottom, following along the same support trendline that helped it reach the low yesterday.

Bulls of the US dollar will have to wait.
Despite Chair Powell's relatively hawkish tone during the opening comments of today's rate decision, the US Dollar was unable to hang on to an earlier rebound that started after the announcement was released. The USD has subsequently dropped to a new five-month bottom, following along the same support trendline that helped it reach the low yesterday.
The level of 103.82 is still applicable. Price is now probing below that level, but if today's daily bar closes above it, it might leave the door open for bullish reversal scenarios in the DXY ahead of tomorrow's rate announcements from Europe and the UK.
US Dollar Daily Price Chart

It might be difficult to put prior patterns into context. In Q3, the USD had become significantly overbought by a variety of indicators, even historically overbought. And this isn't a small-cap tech company; it's the cornerstone of the global economy and trading of the US Dollar, and price movements of this magnitude have repercussions that have yet to be seen.
So, although there is undoubtedly a fundamental impetus arising from rate decisions or economic data, there is also a long-term trend to examine, which helps to explain why bears have had such a strong run in the DXY recently.
The weekly chart below shows how the price hasn't quite erased 50% of the movement that began in early 2021; and we've only crossed the halfway mark of the movement that began this February, as the 104.70 level (the 50% retracement of that huge rise) was in-play just last week.
US Dollar Weekly Chart

EUR/USD
The ECB was slow to raise interest rates this year, owing primarily to anxiety. European GDP lagged behind that of the United States, so even as inflation rose, the ECB looked to have a little leeway.
That has changed in recent rate decisions, as seen by the EUR/USD chart, which has recovered more than 1,000 pips from the late-September low.
Last week, the price closed the weekly EUR/USD bar as a doji, just near a trendline forecast drawn from the swing highs in May 2021 and February 2022. There was an early retracement earlier this week, but the price has since reversed and shown a breakout from that confluent point, with EUR/USD presently trading at new five-month highs.
The major issue is whether the ECB can appease bulls enough with tomorrow's rate decision to keep them bidding the euro higher and past the current barrier. The next big area of resistance on the chart is a confluent area at the psychological threshold of 1.0750. A large block of support is below the price, extending from 1.0500 to a Fibonacci level at 1.0579.
EUR/USD Daily Chart

GBP/USD Cable has come a long way from the collapse-like move seen in GBP/USD in late September. While there was a chorus of calls for parity at the time, the price has since risen from that low, never falling below the 1.0400 level.
And, like with EUR/USD, the positive trend has merely continued to drive thus far in Q4, with GBP/USD again re-approaching the psychological threshold of 1.2500.
There will be a Bank of England rate decision, and the major concern here is the same as it is surrounding the ECB: recessionary worries that will prevent the Central Bank from raising rates further next year. This might lead to a divergence in rate expectations between the US and the UK, allowing trends to shift.
However, the trend is positive at the moment, and the price has received a rebound from the 200-day moving average. So, before bearish scenarios can resurface, there must be some type of concession from bulls who have yet to emerge. If we finish tomorrow with a long-wick resistance response in GBP/USD, that door may begin to reopen.
GBP/USD Daily Price Chart

USD/CAD
The Canadian Dollar remains one of the weakest currencies, and it is one of the few major currencies that has fallen below the US Dollar in the last month.
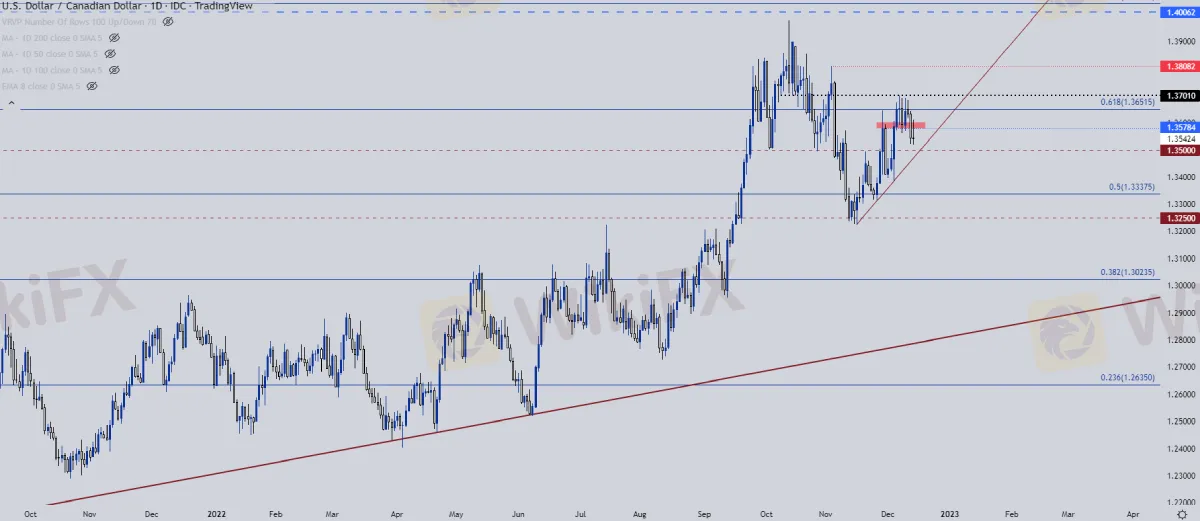
I examined the pair on Monday and found a technical background that might be useful for swing traders here. The Fibonacci level at 1.3652 maintained another inflection, allowing for a support test at the psychological level of 1.3500, which is approaching confluence with a short-term bullish trendline.
This might be one of the more appealing methods of pushing for USD strength given the current CAD weakness.
USD/CAD Daily Price Chart

USD/JPY
As I said on Monday, USD/JPY had a similar appearance to USD, with a tint of extra bullishness brought on by JPY weakness, thus not different from the above in USD/CAD, although in the short term.
The price is still holding lower-high resistance at the Fibonacci level of 137.61, but the matching retreat has subsequently held at a higher low above the early-December swing. And, at this time, the 135 psychological level is in play, aiding in the maintenance of the low, leaving the door open for mean reversion scenarios. If bulls can breakthrough the 135.58 swings, the door opens for a move back up to resistance at the 137.61 level, and if that next test at the Fibonacci level comes after a higher low, breakout potential may continue, with movements up to the next resistance at 138.58 and then 139.60-140.00.
USD/JPY Daily Price Chart

The chance % of Major Currency Pairs may also be found here: https://vps.wikifx.com/en/data/holdposition.html
Keep an eye out for more Daily Currency Analysis.
Use the link below to download and install the WikiFX App, which allows you to stay up to date on the newest news even while you're on the road.
Link to download: https://www.wikifx.com/en/download.html

Disclaimer:
The views in this article only represent the author's personal views, and do not constitute investment advice on this platform. This platform does not guarantee the accuracy, completeness and timeliness of the information in the article, and will not be liable for any loss caused by the use of or reliance on the information in the article.
Read more

March Oil Production Declines: How Is the Market Reacting?
Oil production cuts in March are reshaping the market. Traders are closely watching OPEC+ decisions and supply disruptions, which could impact prices and future production strategies.

How to Calculate Leverage and Margin in the Forex Market
Leverage amplifies both potential profits and risks. Understanding how to calculate leverage and margin helps traders manage risks and avoid forced liquidation.

USD/INR, USD/PHP Forecast April 2025
The global forex markets are bracing for April 2025 with divergent forecasts for key emerging market pairs. In particular, the USD/INR and USD/PHP pairs have attracted significant attention amid a mix of central bank interventions, evolving U.S. policy signals, and regional economic shifts. In this article, we review multiple forecasts, examine the driving factors, and outline what traders might expect as the month unfolds.

April Forex Trends: EUR/USD, GBP/USD, USD/JPY, AUD/USD, USD/CAD Insights
Know April’s forex seasonality trends for EUR/USD, GBP/USD, USD/JPY, AUD/USD, and USD/CAD. Historical insights and key levels to watch in 2025.
WikiFX Broker
Latest News
Exposing the Top 5 Scam Brokers of March 2025: A Closer Look by WikiFX
Gold Prices Climb Again – Have Investors Seized the Opportunity?
Webull Launches SMSF Investment Platform with Zero Fees
Australian Regulator Warns of Money Laundering and Fraud Risks in Crypto ATMs
The Withdrawal Trap: How Scam Brokers Lure Victims into Paying More
FCA to Investors: Think Twice Before Trusting These Brokers
Trump\s tariffs: How could they affect the UK and your money
Trump gambles it all on global tariffs he\s wanted for decades
HTFX Spreads Joy During Eid Charity Event in Jakarta
How Will the Market React at a Crucial Turning Point?
Currency Calculator


