简体中文
繁體中文
English
Pусский
日本語
ภาษาไทย
Tiếng Việt
Bahasa Indonesia
Español
हिन्दी
Filippiiniläinen
Français
Deutsch
Português
Türkçe
한국어
العربية
Natural Gas Shows Signs of Base Formation: Recovery Ahead?
Abstract:The recent increase in natural gas prices suggests a potential recovery, but setbacks are possible. Factors include reduced Canadian gas exports due to wildfires, lower wind power generation, and decreased drilling activity. Technical analysis indicates resistance levels and diminishing downward pressure. Maintaining support above 2.03 is crucial for sustained upward movement.

The recent surge in momentum observed in the natural gas market could indicate the beginning of a potential recovery after a prolonged period of weakness. However, it is important to note that the decline experienced over the past year suggests that any upward movement in prices might be accompanied by setbacks, rather than a continuous rise. One of the factors contributing to the recent boost in natural gas prices is the reduced gas exports from Canada, primarily caused by wildfires in Alberta and other western provinces. Additionally, the decrease in wind power generation last week led to higher utilization of natural gas for electricity production, further supporting the prices.
Furthermore, the decline in drilling activity due to oversupply conditions and stricter credit conditions makes it less likely for natural gas prices to experience a significant further decline. The United States Energy Information Administration's Short-term Energy Outlook anticipates that the U.S. natural gas spot price will increase towards 3.71 by December.
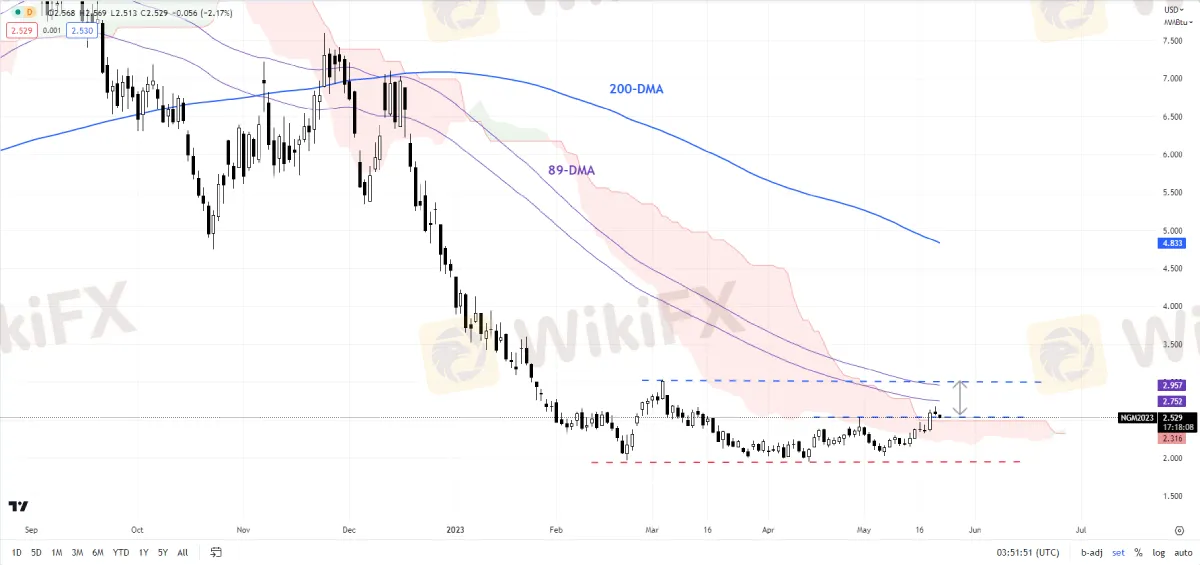
Natural Gas Daily Chart

From a technical analysis perspective, natural gas is currently attempting to surpass a crucial resistance level at the April high of 2.52, which aligns with the upper boundary of the Ichimoku channel on the daily charts. A successful breakout above this level could potentially pave the way for further upward movement toward the March high of 3.03. However, it should be noted that overcoming this level might prove challenging, at least initially.

On the whole, the downward pressure on natural gas prices seems to be diminishing, as suggested by the color-coded candlestick charts that utilize trending and momentum indicators. Moreover, market diversity has been at exceptionally low levels, indicating a potential shift in market dynamics. These observations are consistent with the analysis presented in the articles titled “Natural Gas Price Setup: Downward Pressure is Abating,” published on April 11, and “Natural Gas Price Rebound Could Extend; What's Next for Crude Oil?” published on May 18.
Natural Gas Monthly Chart

To maintain the short-term upward pressure, it is crucial for natural gas prices to remain above the support level established in early May at 2.03. A decline below this support level would increase the risk of a renewed downward movement in prices.
Note: The color-coded chart mentioned in the article is designed to visually represent the prevailing trend in natural gas prices. Blue candles indicate a bullish phase, red candles indicate a bearish phase and grey candles represent consolidation phases that can occur within both bullish and bearish trends, sometimes appearing towards the end of a trend. It should be noted that the candle color is not predictive and may change in the subsequent bar. False patterns can also occur around the 200-period moving average, support/resistance levels, and in sideways or choppy markets. The author does not guarantee the accuracy of the information provided, and past performance should not be considered indicative of future performance. Users should exercise caution and make their own decisions when using this information, as they assume any associated risks.
Download and install the WikiFX App on your smartphone to stay updated on the latest news.
Download the App here: https://social1.onelink.me/QgET/px2b7i8n

Disclaimer:
The views in this article only represent the author's personal views, and do not constitute investment advice on this platform. This platform does not guarantee the accuracy, completeness and timeliness of the information in the article, and will not be liable for any loss caused by the use of or reliance on the information in the article.
Read more

INFINOX Partners with Acelerador Racing for Porsche Cup Brazil 2025
INFINOX has teamed up with Acelerador Racing, sponsoring an Acelerador Racing car in the Porsche Cup Brazil 2025. This partnership shows INFINOX’s strong support for motorsports, adding to its current sponsorship of the BWT Alpine F1 Team.

The Daily Habits of a Profitable Trader
Every professional trader follows a structured approach to ensure they are well-prepared, disciplined, and able to seize opportunities with confidence. Whether you are a seasoned investor or an aspiring trader, adhering to a robust daily checklist can significantly enhance your performance. Use this checklist to check if you are a qualified trader

The Impact of Interest Rate Decisions on the Forex Market
Interest rate changes determine currency attractiveness, influencing capital flows and exchange rate trends. Understanding this mechanism helps investors navigate the forex market effectively.

How a Housewife Lost RM288,235 in a Facebook Investment Scam
A 47-year-old housewife in Malaysia recently fell victim to an online investment scam, losing a substantial sum of RM288,235 after engaging with a fraudulent scheme advertised on Facebook.
WikiFX Broker
Latest News
TradingView Brings Live Market Charts to Telegram Users with New Mini App
Trump tariffs: How will India navigate a world on the brink of a trade war?
Interactive Brokers Launches Forecast Contracts in Canada for Market Predictions
Authorities Alert: MAS Impersonation Scam Hits Singapore
Stocks fall again as Trump tariff jitters continue
INFINOX Partners with Acelerador Racing for Porsche Cup Brazil 2025
Regulatory Failures Lead to $150,000 Fine for Thurston Springer
April Forex Trends: EUR/USD, GBP/USD, USD/JPY, AUD/USD, USD/CAD Insights
March Oil Production Declines: How Is the Market Reacting?
Georgia Man Charged in Danbury Kidnapping and Crypto Extortion Plot
Currency Calculator


