简体中文
繁體中文
English
Pусский
日本語
ภาษาไทย
Tiếng Việt
Bahasa Indonesia
Español
हिन्दी
Filippiiniläinen
Français
Deutsch
Português
Türkçe
한국어
العربية
CMC Markets News: Taking Advantage of the Japanese Yen's Weakening to Find Trend Trading Chances
abstrak:SD/JPY and other JPY currency cross-pairs have been on a bullish run, while the Japanese Yen has been losing value throughout March, hitting an almost 7-year low vs the US Dollar.
SDJPY and other JPY currency cross-pairs have been on a bullish run, while the Japanese Yen has been losing value throughout March, with the currency recently reaching an almost 7-year low versus the US Dollar. This is due, in part, to the BoJ's and the Federal Reserve's divergent monetary policy orientations, as well as inflationary pressures, since Japan is a net importer of numerous major commodities. If these two elements stay unchanged in the near term, there may be a fundamental and technical rationale to continue seeking for long chances in JPY cross-pairs.
The monthly USDJPY chart below shows the price nearing the June 2015 high of 125.85 (shown in red), as well as two additional major levels of support/resistance (marked in pink), at about 123.50 and 121.50. With just one trading day remaining in March, a positive outlook is more likely if the month concludes solidly above at least one of these support levels.
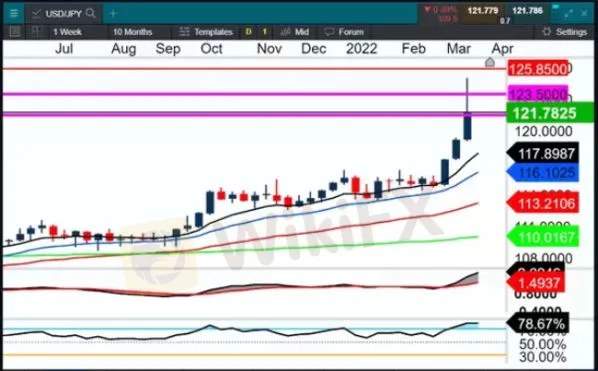
The weekly chart below shows an uptrend, with higher highs and lower lows in price action, with the 10, 20, 50, and 200 MAs lined up and exhibiting solid bullish geometry. The MACD and RSI indicators indicate positive convergence with price, suggesting that the upswing may still have some traction.

An uptrend in price activity can also be observed on the daily chart below, with repeated higher highs and lower lows. The 10, 20, 50, and 200 MAs are aligned, heading higher and spreading out, confirming the existing uptrend. The MACD and RSI indicators are converging bullishly with price, which might indicate that the uptrend is continuing gaining traction.
Price has begun to retrace back into the 'buy zone,' defined as the region between the 10 and 20 MAs, and is now challenging the horizontal level of support at 121.50. A bullish candle printing in this level might signal the start of a new upward trend. If the 123.50 level breaks to the upside, there may be additional chances to purchase on the horizon, both on this timeframe and on lesser timeframes such as the four-hourly, and the price may go up to the next significant level of resistance around 125.85, and maybe beyond, if the uptrend continues.

Should the 123.50 level prove too strong, an alternate scenario would be a move back down to support around 118.00.

Disclaimer:
Ang mga pananaw sa artikulong ito ay kumakatawan lamang sa mga personal na pananaw ng may-akda at hindi bumubuo ng payo sa pamumuhunan para sa platform na ito. Ang platform na ito ay hindi ginagarantiyahan ang kawastuhan, pagkakumpleto at pagiging maagap na impormasyon ng artikulo, o mananagot din para sa anumang pagkawala na sanhi ng paggamit o pag-asa ng impormasyon ng artikulo.
Magbasa pa ng marami

Challenge Yourself: Transform from Novice to Expert
From a forex novice to a trading expert, all it takes is this one opportunity! Join us for the Forex Beginner's Advancement Journey challenge and unlock your potential! Here, if you're a beginner, participating in the event and posting on selected topics will not only deepen your understanding of forex basics and help you advance but also earn you a Learning Encouragement Award. For those with some experience in forex, discussing insights under the event topics will allow you to exchange experiences and share techniques with like-minded peers, while also having the chance to win a Perspective Sharing Award! Come challenge yourself and break through the limits of forex trading together!

Sa likod ng Orfinex Prime Brokerage: Isang kaso ng pagsalangsang at negligencia
Orfinex Prime: Mga Allegasyon ng Negligencia at Paglabas | Ang mga problema ng mga kliyente ay nagpapahayag ng mga hindi ligtas na pamamaraan sa pagbebenta, malinaw na presensya sa Dubai, at mga alalahanin ng pagsalangsang. Gumawa ng mga aksyon para sa proteksyon ng mga mamimili.

I-claim ang Iyong 50% Welcome Bonus hanggang $5000!
Bukas sa Parehong Bago at Existing na Customer!

The pound, gilts and renewables: the winners and losers under Britain’s future PM
The race to be the next leader of Britain’s ruling-Conservative Party and the country’s prime minister is into its final leg, with the September outcome likely to shape the fortunes of sterling, gilts and UK stocks in coming months.
Broker ng WikiFX
Exchange Rate


