简体中文
繁體中文
English
Pусский
日本語
ภาษาไทย
Tiếng Việt
Bahasa Indonesia
Español
हिन्दी
Filippiiniläinen
Français
Deutsch
Português
Türkçe
한국어
العربية
How to Use Williams %R (Williams Percent Range)
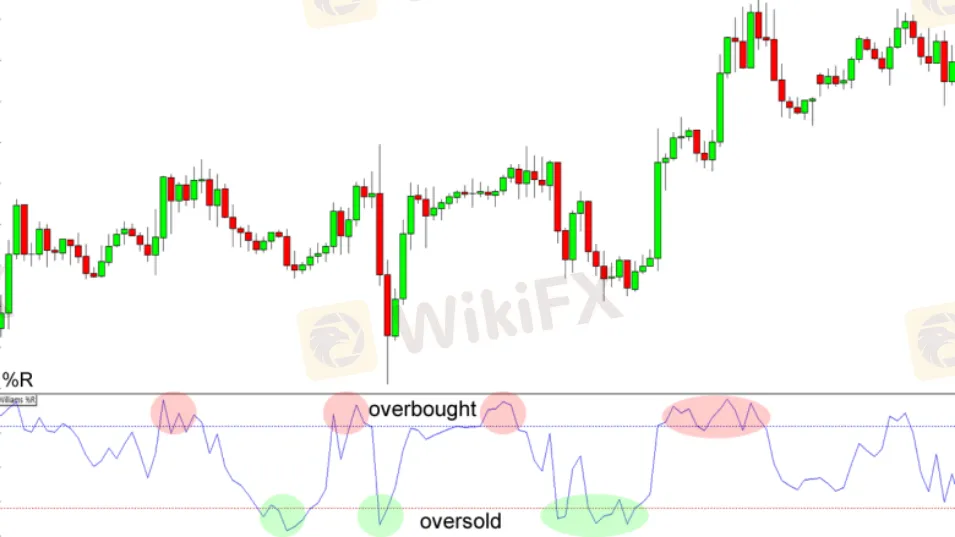
Abstract:Williams %R, also known as the Williams Percent Range, is a type of momentum indicator that moves between 0 and -100 and measures overbought and oversold levels. The Williams %R may be used to find entry and exit points in the market. It shows where the last closing price is relative to the highest and lowest prices of a given time period.
Williams %R, also known as the Williams Percent Range, is a type of momentum indicator that moves between 0 and -100 and measures overbought and oversold levels. The Williams %R may be used to find entry and exit points in the market. It shows where the last closing price is relative to the highest and lowest prices of a given time period.
The indicator is very similar to the Stochastic oscillator and is used in the same way. It was developed by Larry Williams and it compares a stocks closing price to the high-low range over a specific period, typically 14 days or periods.

But while RSI uses its mid-point figure (50) to determine trend strength, traders use %Rs extreme levels (-20 and -80) for cues.
How to Trade Forex Using the Williams %R Indicator
If you know how to Trade Stochastic, then it will be quite helpful for you to understand How to trade forex using the Williams %R , because the %R use the same formula as that of Stochastic to pinpoint the relative location of a currency pair. What differentiate the two is that Stochastic shows you a relative location by using the lowest price in a time range while %R uses the highest price to pinpoint the closing prices position.
Obviously, if you turn around the %R line, it will have precisely equal line as Stochastics %K line. Which is why Williams %R uses the 0 to -100 scale while Stochastic is scaled from 0 to 100.
A reading above -20 is OVERBOUGHT.
A reading below -80 is OVERSOLD.
An overbought or oversold reading does not confirm that the price will reverse. All “overbought” means the price is close tothe highs of its current range.
Also The same applies for oversold, that All “oversold” means the price is close to the lows of its current range.
Determining Trend Strength Using %R
The nature of Williams %Rs of reactivity to volatile prices comes in an easy to use when you want to know if prices are maintaining their bullish momentum or otherwise.
In EUR/USD‘s daily chart below, you can observe that the pair tried to expand its uptrend but failed to reach a new price and %R highs. Which means that prices aren’t hitting the high end of their range as early as they did before and that the bullish momentum might be running out of steam. For this situation, the pair ended up dropping 200 pips in a week!

Nearly right away after that, the price gained enough bullish momentum to push %R above its oversold levels. But even though EUR/USD is still exploding up red candlesticks, yet theyre not sufficient to drag Williams %R back to its previous lows. This can be another loss of momentum and so Williams %R are forbsure thought.
Now It emerged that, the bulls did take over and pushed EUR/USD around 775 pips higher in less than 30 days. And the oscillating is now good there, so it is not surprising to hear superfans call Williams %R as “The Ultimate Oscillator!”
Disclaimer:
The views in this article only represent the author's personal views, and do not constitute investment advice on this platform. This platform does not guarantee the accuracy, completeness and timeliness of the information in the article, and will not be liable for any loss caused by the use of or reliance on the information in the article.
Read more

Forex is a game that I enjoy playing
These champions have one thing in common: they not only work their butts off, but they also enjoy what they do.

Wait patiently. Maintain your discipline
"Patience is the key to everything," American comic Arnold H. Glasgow once quipped. The chicken is gotten by hatching the egg rather than crushing it."

There isn't a Holy Grail to be found!
Ask any Wall Street quant (the highly nerdy math and physics PhDs who build complicated algorithmic trading techniques) why there isn't a "holy grail" indicator, approach, or system that generates revenues on a regular basis.

Concentrate on the Process. Profits aren't a priority
We've designed the School of WikiFX as simple and enjoyable as possible to help you learn and comprehend the fundamental tools and best practices used by forex traders all over the world, but keep in mind that a tool or strategy is only as good as the person who uses it.
WikiFX Broker
Currency Calculator


