简体中文
繁體中文
English
Pусский
日本語
ภาษาไทย
Tiếng Việt
Bahasa Indonesia
Español
हिन्दी
Filippiiniläinen
Français
Deutsch
Português
Türkçe
한국어
العربية
Triangle Chart Patterns: How to Trade Them
Abstract:The triangular pattern is grouped as a "continuation pattern," which means that immediately the pattern is completed, the price is expected to continue in the trend direction in which it was traveling before the pattern take place.
Price moves into a tighter and tighter range as time passes in a triangle chart pattern, displaying a visual conflict between bulls and bears.
The triangular pattern is grouped as a “continuation pattern,” which means that immediately the pattern is completed, the price is expected to continue in the trend direction in which it was traveling before the pattern take place.
When there are at least five contacts of support and resistance, a triangle pattern is believed to be formed.
Three touches on the support line, for example, and two on the resistance line. Alternatively, vice versa.
There are three categories of triangle chart formations, just like there are three small pigs: symmetrical triangle, ascending triangle, and descending triangle.
Triangle with Symmetry
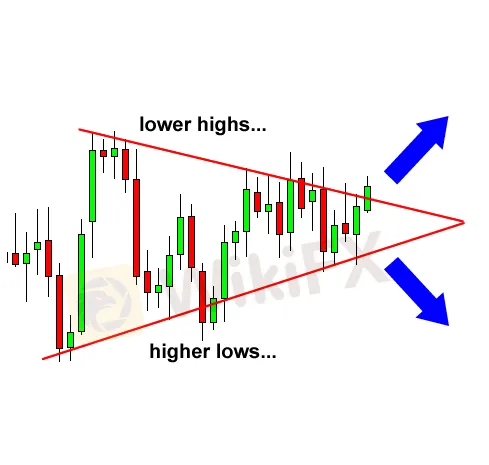
A symmetrical triangle is a chart pattern in which the slopes of the price highs and lows converge to form a triangular shape.
The market is producing lower highs and higher lows during this pattern.
This indicates that neither the buyers nor the sellers are willing to push the price down far enough to establish a clear trend.
This would be a draw if this were a war between buyers and sellers.
This is also a kind of consolidation.

We can see from the graph above that neither the buyers nor the sellers were able to influence the price in their favor. As a result, we get lower highs and higher lows.
The closer these two slopes come to each other, the closer a breakout will be.
We don't know which way the market will break out, but we do know that it will most probably break out. One side of the market will eventually yield.
So, how can we make the most of it?
We can put entry orders above the lower highs' slope and below the higher lows' slope in a symmetrical triangle.
We can just hitch a ride in whatever way the market moves because we already know the price will break out.

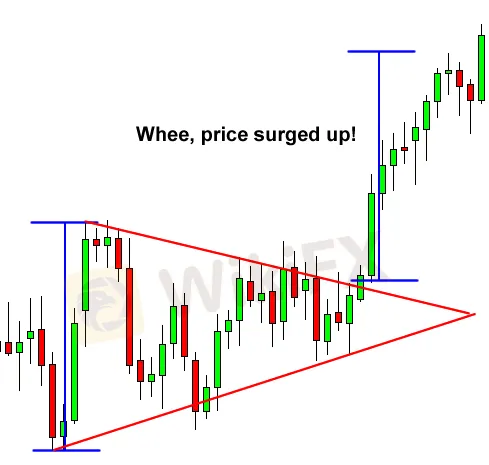
We would have been carried along for a pleasant ride up if we had placed an entry order above the slope of the lower highs in this case.
If you'd put a second entry order below the slope of the higher lows, you'd cancel it immediately the first one was fulfilled.
Triangle Ascending
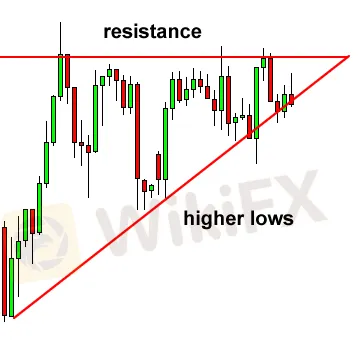
When there is a resistance level and a slope of rising lows, the chart pattern is called an ascending triangle.
What happens during this period is that the purchasers seem to be unable to get above a particular point. Though, as indicated by the rising lows, they are steadily pushing the price up.

Because the buyers are making higher lows, you can see that they are gaining strength in the chart above.
They continue to apply pressure to that resistance level, implying that a breakout is imminent.
“Which way will it go now?” is the question. Will the buyers be able to break through that resistance, or will it be too strong?
Many charting manuals will tell you that in the vast majority of cases, the buyers will triumph and the price will break through the resistance.
However, our experience has shown that this is not always the case.
Sometimes the resistance is too high, and there isn't enough purchasing power to overcome it.
The majority of the time, the price will increase.
The point we're trying to convey is that you shouldn't be preoccupied with which way the price moves, but rather that you should be prepared for movement in ANY direction.
We'd place an entry order above the resistance line and below the slope of the higher lows in this situation.

The purchasers lost the battle in this case, and the price plummeted! You can see that the descent was about the same length as the triangular formation's height.
We could have gotten some pips off that dive if we had positioned our short order below the bottom of the triangle.
Triangle Descending
As you may expect, descending triangles are the polar opposite of ascending triangles (we knew you were clever!).
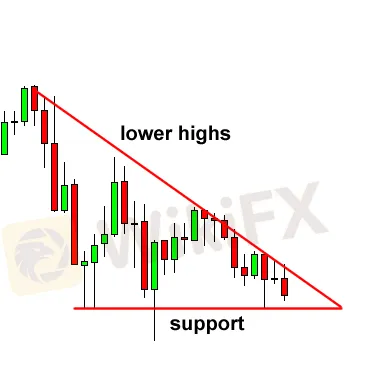
The top line in descending triangle chart patterns is formed by a run of lower highs. The lower line represents a support level that the price does not seem to be able to break through.

As you can see in the chart above, the price is gradually establishing lower highs, indicating that the sellers are gaining ground on the purchasers.
Most of the time, and we do mean MOST of the time, the price will break through the support line and continue to decrease.
However, the support line may be too strong in some circumstances, causing the price to bounce off and make a big upward rise.
The good news is that it makes no difference to us where the price goes. We just know it's about to take a turn.
We'd put entry orders above the upper line (lower highs) and below the support line in this situation.

The price ended up breaking over the top of the triangle pattern in this example.
Following the upward breakout, it surged higher by roughly the same vertical distance as the triangle's height.
Placing an entry order above the top of the triangle and aiming for a goal as high as the formation's height would have resulted in significant profits.
Disclaimer:
The views in this article only represent the author's personal views, and do not constitute investment advice on this platform. This platform does not guarantee the accuracy, completeness and timeliness of the information in the article, and will not be liable for any loss caused by the use of or reliance on the information in the article.
Read more

Forex is a game that I enjoy playing
These champions have one thing in common: they not only work their butts off, but they also enjoy what they do.

Wait patiently. Maintain your discipline
"Patience is the key to everything," American comic Arnold H. Glasgow once quipped. The chicken is gotten by hatching the egg rather than crushing it."

There isn't a Holy Grail to be found!
Ask any Wall Street quant (the highly nerdy math and physics PhDs who build complicated algorithmic trading techniques) why there isn't a "holy grail" indicator, approach, or system that generates revenues on a regular basis.

Concentrate on the Process. Profits aren't a priority
We've designed the School of WikiFX as simple and enjoyable as possible to help you learn and comprehend the fundamental tools and best practices used by forex traders all over the world, but keep in mind that a tool or strategy is only as good as the person who uses it.
WikiFX Broker
Currency Calculator


