简体中文
繁體中文
English
Pусский
日本語
ภาษาไทย
Tiếng Việt
Bahasa Indonesia
Español
हिन्दी
Filippiiniläinen
Français
Deutsch
Português
Türkçe
한국어
العربية
Spot Gold Price Chart Reveals Plunge Towards Support as USD Rips Higher
Abstract:Spot gold is coming under pressure today, likely in response to a surging US Dollar following less-dovish remarks from Fed officials revealed in the latest FOMC minutes. Which key XAUUSD technical levels might be targeted next?
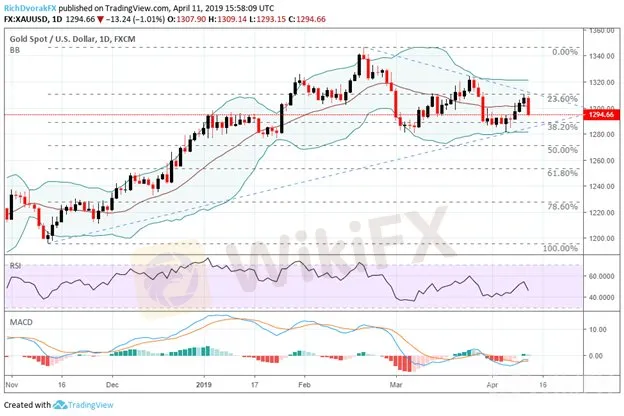
Gold is sinking today with spot prices trading roughly 1 percent lower and could put the medium-term bullish uptrend at risk if the precious metal falls further. Month-to-date spot gold performance remains in positive territory, however, despite todays drop pushing gold below psychological support at the $1,300 level.
SPOT GOLD PRICE CHART: DAILY TIME FRAME (OCTOBER 31, 2018 TO APRIL 11, 2019)

Spot gold enjoyed a healthy rebound higher earlier this month after prices based at the 38.2 percent Fibonacci retracement line drawn from the low recorded in November 2018 and top printed in February 2019. Although, the short-lived advance was halted once XAUUSD approached $1,310 yesterday where the 23.6 percent Fib and recent downtrend line rejected further upside. Less-dovish Fed language revealed in the March FOMC minutes could be contributing to the selling pressure in gold considering a surging US Dollar and rebounding interest rates make gold less attractive.
Now, XAUUSD is re-approaching technical support near the $1,285 price where prices have formed a strong area of confluence. Long-term uptrend support formed by the lows in November 2018 and earlier this month has potential to bolster gold prices while the 38.2 percent Fib looks to provide support once again. Nevertheless, a break below the rising trendline would likely threatens golds longer-term uptrend while a move above the falling trendline could reassert a bullish bias.
SPOT GOLD TRADER SENTIMENT PRICE CHART: DAILY TIME FRAME (OCTOBER 15, 2018 TO APRIL 11, 2019)

Check out IGs Client Sentiment here for more detail on the bullish and bearish biases of EURUSD, GBPUSD, USDJPY, Gold, Bitcoin and S&P500.
According to client positioning data from IG, 74.6 percent of spot gold traders are net-long with the ratio of traders long to short at 2.93 to 1. Although, the number of traders net-long is 8.7 percent lower than yesterday and 6.5 percent lower than last week.
Disclaimer:
The views in this article only represent the author's personal views, and do not constitute investment advice on this platform. This platform does not guarantee the accuracy, completeness and timeliness of the information in the article, and will not be liable for any loss caused by the use of or reliance on the information in the article.
Read more

KVB Market Analysis | 30 August: JPY Strengthens Against USD Amid Strong Q2 GDP and BoJ Rate Hike Speculation
The Japanese Yen (JPY) strengthened against the US Dollar (USD) on Thursday, boosted by stronger-than-expected Q2 GDP growth in Japan, raising hopes for a BoJ rate hike. Despite this, the USD/JPY pair found support from higher US Treasury yields, though gains may be capped by expectations of a Fed rate cut in September.

KVB Market Analysis | 28 August: Yen Strengthens on BoJ Rate Hike Hints; USD/JPY Faces Uncertainty
The Japanese Yen rose 0.7% against the US Dollar after BoJ Governor Kazuo Ueda hinted at potential rate hikes. This coincided with a recovery in Asian markets, aided by stronger Chinese stocks. With the July FOMC minutes already pointing to a September rate cut, the US Dollar might edge higher into the weekend.

KVB Market Analysis | 27 August: AUD/USD Holds Below Seven-Month High Amid Divergent Central Bank Policies
The Australian Dollar (AUD) traded sideways against the US Dollar (USD) on Tuesday, staying just below the seven-month high of 0.6798 reached on Monday. The downside for the AUD/USD pair is expected to be limited due to differing policy outlooks between the Reserve Bank of Australia (RBA) and the US Federal Reserve. The RBA Minutes indicated that a rate cut is unlikely soon, and Governor Michele Bullock affirmed the central bank's readiness to raise rates again if necessary to combat inflation.

KVB Market Analysis | 23 August: JPY Gains Ground Against USD as BoJ Signals Possible Rate Hike
JPY strengthened against the USD, pushing USD/JPY near 145.00, driven by strong inflation data and BoJ rate hike expectations. Japan's strong Q2 GDP growth added support. However, USD gains may be limited by expectations of a Fed rate cut in September.
WikiFX Broker
Latest News
The Withdrawal Trap: How Scam Brokers Lure Victims into Paying More
FCA to Investors: Think Twice Before Trusting These Brokers
Trump\s tariffs: How could they affect the UK and your money
Trump gambles it all on global tariffs he\s wanted for decades
TradingView Brings Live Market Charts to Telegram Users with New Mini App
Trump tariffs: How will India navigate a world on the brink of a trade war?
Interactive Brokers Launches Forecast Contracts in Canada for Market Predictions
Authorities Alert: MAS Impersonation Scam Hits Singapore
Stocks fall again as Trump tariff jitters continue
IG Group Acquires Freetrade for £160M to Expand UK Investment Market
Currency Calculator


