简体中文
繁體中文
English
Pусский
日本語
ภาษาไทย
Tiếng Việt
Bahasa Indonesia
Español
हिन्दी
Filippiiniläinen
Français
Deutsch
Português
Türkçe
한국어
العربية
Gold Price Weekly Outlook: XAU Breakdown Stalls at Technical Support
Abstract:Gold plummeted nearly 2.6% from the May high with the sell-off now testing the yearly low-day close. These are the levels that matter on the XAU/USD weekly chart.
Gold price sell-off testing confluence support- focus is on weekly close around 1275/76
黄金价格抛售测试合并支持 - 焦点是每周收盘于1275/76附近
In this series we scale-back and look at the broader technical picture to gain a bit more perspective on where we are in trend. Gold is virtually unchanged for the week thus far, with price now testing a major technical support zone we‘ve been tracking for months. These are the updated targets and invalidation levels that matter on the XAU/USD weekly price chart. Review this week’s Strategy Webinar for an in-depth breakdown of this setup and more.
在本系列中,我们缩小并查看更广泛的技术图片,以更多地了解我们的趋势。到目前为止,本周金价几乎没有变化,现在价格正在测试我们已经追踪数月的主要技术支持区域。这些是XAU / USD每周价格图表中重要的更新目标和失效水平。回顾本周的战略网络研讨会,深入了解此设置及其他内容。
New to Gold Trading? Get started with this Free How to Trade Gold -Beginners Guide
黄金交易新手入门?开始使用此免费黄金交易指南
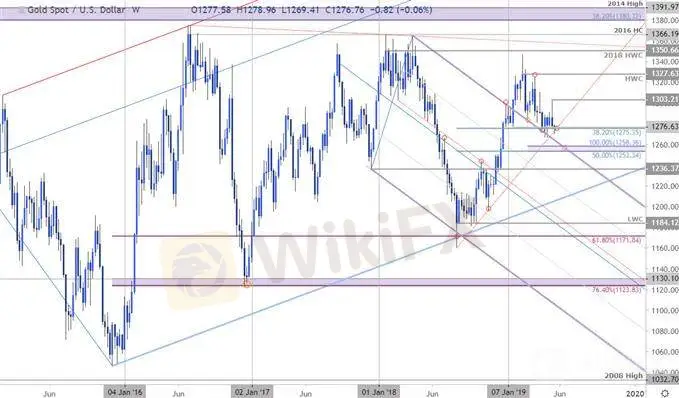
Gold Weekly Price Chart (XAU/USD)
黄金周价格表(XAU / USD)

Notes: In my last Gold Price Outlook we warned to be, “on the lookout for downside exhaustion here near-term,” as price was attempting to confirm a weekly close below confluence support at 1275/76- a region defined by the yearly opening-range low and the 38.2% retracement of the 2018 advance. Nearly three-weeks later and price has failed to mark a weekly close below- note that the August trendline also converges on this zone over the next two weeks and we're looking for a resolution.
注:我上一次的黄金价格展望我们警告称,“在近期注意下行疲惫”,因为价格试图确认每周收盘价低于汇价支撑位1275 / 76-一个由年度开盘低点和38.2%回撤线定义的区域2018年的进展。差不多三个星期后,价格未能在每周收盘价下方 - 请注意8月趋势线在接下来的两周内也会收敛于该区域,我们正在寻找解决方案。
Gold posted an outside-weekly reversal off fresh monthly highs last week with the sell-off taking gold prices back into this key zone. A weekly close below is still needed to fuel another leg lower targeting more significant support / broader bullish invalidation at 1253/58. Monthly open resistance stands at 1283 backed by the May range high at 1303- a close above would be needed to validate the turn targeting the 2019 high-week close at 1327.
黄金上周公布了每周新的月度高点逆转,因为抛售将金价重新带回这个关键区域。仍然需要每周收盘低于另一条腿,以更加重要的支撑/ 1253/58更广泛的看涨无效为目标。月度开盘阻力位于1283,受到5月区间高点1303的支撑 - 收盘价将高于上方ded验证转向目标为2019年高点收盘价1327。
Bottom line: The immediate focus is on the weekly close in relation to the 1275/76 zone. From a trading standpoint, a good spot to reduce short-exposure / lower protective stops. A weekly close below would leave the focus on 1253/58- look for a bigger reaction there IF reached. Ill publish an updated Gold Price Outlook once we get further clarity in near-term price action. Review our latest Gold 2Q forecasts for a longer-term look at the technical picture for XAU/USD prices.
底线:立即关注与1275/76区域相关的每周收盘价。从交易的角度来看,这是减少短期曝光/降低保护性停留的好地方。每周收盘低于1253 / 58-会在IF达到更大的反应。一旦我们进一步明确近期价格行动,我就会发布更新的黄金价格展望。查看我们最新的黄金2Q预测,以便长期了解XAU / USD价格的技术图片。
E
Gold Trader Sentiment
黄金交易员情绪

A summary of IG Client Sentiment shows traders are net-long Gold - the ratio stands at +4.32 (81.2% of traders are long) – bearish reading
IG客户情绪摘要显示,交易者持有净多头黄金 - 该比率为+4.32(交易者持有的比例为81.2%) - 看跌读数
The percentage of traders net-long is now its highest since November 25th
交易者净多头的百分比现在是11月25日以来的最高值
Long positions are 0.2% lower than yesterday and 11.6% higher from last week
多头比期低0.2%昨日较上周上涨11.6%
Short positions are 8.8% lower than yesterday and 29.8% lower from last week
空头头寸较昨日减少8.8%,较上周减少29.8%
We typically take a contrarian view to crowd sentiment, and the fact traders are net-long suggests Gold prices may continue to fall. Traders are further net-long than yesterday & last week, and the combination of current positioning and recent changes gives us a stronger Gold-bearish contrarian trading bias from a sentiment standpoint.
我们通常采取逆向诉讼人群情绪高涨,交易商净多头表明黄金价格可能继续下跌。交易商比昨天和上周进一步净多头,目前的定位和最近的变化相结合,使我们从情绪的角度看待黄金利空的逆势交易偏向。
Disclaimer:
The views in this article only represent the author's personal views, and do not constitute investment advice on this platform. This platform does not guarantee the accuracy, completeness and timeliness of the information in the article, and will not be liable for any loss caused by the use of or reliance on the information in the article.
Read more

Breakthrough again! Gold breaks through $2530 to set a new record high!
Spot gold continued its record-breaking rally as investors gained confidence that the Federal Reserve might cut interest rates in September and gold ETF purchases improved. The U.S. market hit a record high of $2,531.6 per ounce

Historic Moment: Gold Surges Above $2,500 Mark, Forging Glory!
Boosted by the weakening of the US dollar and the expectation of an imminent rate cut by the Federal Reserve, spot gold broke through $2,500/ounce, setting a new record high. It finally closed up 2.08% at $2,507.7/ounce. Spot silver finally closed up 2.31% at $29.02/ounce.

Weekly Analysis: XAU/USD Gold Insights
Gold prices have been highly volatile, trading near record highs due to various economic and geopolitical factors. Last week's weak US employment data, with only 114,000 jobs added and an unexpected rise in the unemployment rate to 4.3%, has increased the likelihood of the Federal Reserve implementing rate cuts, boosting gold's appeal. Tensions in the Middle East further support gold as a safe-haven asset. Technical analysis suggests that gold prices might break above $2,477, potentially reachin

【MACRO Insight】Monetary Policy and Geopolitics - Shaping the Future of Gold and Oil Markets!?
In the ever-evolving global economy, the intertwining influences of monetary policy and geopolitical factors are reshaping the future of the gold and crude oil markets. This spring, the gold market saw a significant uptrend unexpectedly, while Brent crude oil prices displayed surprising stability. These market dynamics not only reflect the complexity of the global economy but also reveal investors' reassessment of various asset classes.
WikiFX Broker
Latest News
Germany's Election: Immigration, Economy & Political Tensions Take Centre Stage
WikiFX Review: Is IVY Markets Reliable?
Brazilian Man Charged in $290 Million Crypto Ponzi Scheme Affecting 126,000 Investors
ATFX Enhances Trading Platform with BlackArrow Integration
Become a Full-Time FX Trader in 6 Simple Steps
IG 2025 Most Comprehensive Review
SEC Drops Coinbase Lawsuit, Signals Crypto Policy Shift
Construction Datuk Director Loses RM26.6 Mil to UVKXE Crypto Scam
Should You Choose Rock-West or Avoid it?
Franklin Templeton Submitted S-1 Filing for Spot Solana ETF to the SEC on February 21
Currency Calculator


