简体中文
繁體中文
English
Pусский
日本語
ภาษาไทย
Tiếng Việt
Bahasa Indonesia
Español
हिन्दी
Filippiiniläinen
Français
Deutsch
Português
Türkçe
한국어
العربية
Crude Oil Price Outlook Remains Fragile - Will Near-Term Support Hold?
Abstract:Crude oils sharp sell-off has halted in the short-term as the market hits support off an important Fibonacci level.
Crude Oil Price Chart and Analysis:
Crude oil hits support – will it hold?
Oil looks heavily oversold in the short-term.
The Brand New DailyFX Q2 2019 Trading Forecast and Guides are Available to Download Now!!
How to Trade Oil: Crude Oil Trading Strategies & Tips.
Crude Oil Slump
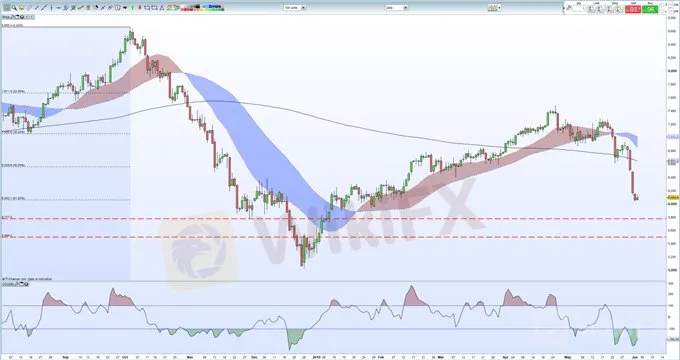
The price of a barrel of crude oil fell by over 12% last week as trade fears heightened, undermining global growth concerns. Oil also fell through noted support levels, including the 200-day moving average, which accelerated the move lower and took oil to a five-month low. We warned two-weeks ago that chart support looked weak with the 50% Fibonacci retracement level breached in subsequent days.
Oil has now bounced off the 61.8% Fibonacci retracement level and this may hold in the short-term, unless trade war rhetoric increases. The crude oil chart is also flashing an extreme oversold signal with the CCI indicator at once stage hitting -250, a level not seen since mid-December last year when the price of oil touched $50.0/bbl.
Support on the chart is seen at $60.63/bbl. – the previously mentioned Fibonacci retracement level –ahead of a cluster of highs/lows around the $59/bbl. area. Crude oil will need to consolidate around current levels, or higher, to start rebuilding some confidence in the market, which has fallen nearly 20% in less than six weeks. To the upside, the gap created on last Fridays (May 31) candle between $61.6/bbl. and $64.9/bbl. will be the bulls first target.
Crude Oil Price Collapses Through Key Supports: More to Go?
WTI vs Brent: Top 5 Differences Between WTI and Brent Crude Oil
Crude Oil Daily Price Chart (August 2018 – June 3, 2019)

Traders may be interested in two of our trading guides – Traits of Successful Traders and Top Trading Lessons – while technical analysts are likely to be interested in our latest Elliott Wave Guide.
Disclaimer:
The views in this article only represent the author's personal views, and do not constitute investment advice on this platform. This platform does not guarantee the accuracy, completeness and timeliness of the information in the article, and will not be liable for any loss caused by the use of or reliance on the information in the article.
Read more

Nasdaq Bullish, Encourage by Upbeat U.S. Job Data
The financial markets reacted positively to the upbeat Initial Jobless Claims data released yesterday, which came in at 233k, lower than market expectations. This eased concerns about a weakening labour market and the heightened recession risks that emerged after last Friday's disappointing NFP report. Wall Street benefited from the improved risk appetite, with the Nasdaq leading gains, surging by over 400 points in the last session.

OnEquity Empowers Traders with High Leverage Options Across Diverse Markets
OnEquity, a leading online trading platform, announces its extensive leverage options, offering traders greater control and flexibility across various markets including commodities, CFDs on stocks, indices, cryptocurrencies, oil, and precious metals.

Higher Tokyo CPI Bolsters BoJ Rate Hike Expectation
Wall Street continues to face downside risks, with the Nasdaq and S&P 500 sliding in yesterday's session while the Dow Jones eked out a marginal gain.

Dollar Dip on Dovish Fed’s Beige Book
The dollar continues to tumble, trading at its lowest level since April, below the $104 mark. The U.S. Beige Book suggests economic growth has moderated and inflation shows signs of easing, strengthening the likelihood of a September rate cut. Improved risk appetite in the market propelled the Dow Jones up nearly 300 points in the last session, breaking its all-time high.
WikiFX Broker
Latest News
How to Automate Forex and Crypto Trading for Better Profits
Wolf Capital Exposed: The $9.4M Crypto Ponzi Scheme that Lured Thousands with False Promises
Confirmed! US December non-farm payroll exceeded expectations
Is Infinox a Safe Broker?
How Did the Dollar Become the "Dominant Currency"?
400 Foreign Nationals Arrested in Crypto Scam Raid in Manila
Singapore Blocks Polymarket Access, Following U.S. and France
OneZero Collaborates with Ladies Professional Golf Association (LPGA)
FxPro Adds CoP via tell. Money for Safer Financial Transfers
Is Your Zodiac Sign Fated for Stock Market Success in 2025?
Currency Calculator


