简体中文
繁體中文
English
Pусский
日本語
ภาษาไทย
Tiếng Việt
Bahasa Indonesia
Español
हिन्दी
Filippiiniläinen
Français
Deutsch
Português
Türkçe
한국어
العربية
Volatility: The SKEW Index and Stock Market Crashes
Abstract:The SKEW Index seeks to measure the probability of Black Swan events and stock market crashes, but its track record in doing so is less than stellar.
The SKEW Index and Stock Market Crashes:
SKEW指数和股市崩盘:
Despite rising global uncertainty, an indicator that tracks the potential for a Black Swan event has slipped to decade-lows
尽管全球不确定性上升,但指标显示追踪黑天鹅事件的潜力已经跌至十年低点
But according to past performance, the Index has been a poor indicator of stock market volatility
但根据过去的表现,该指数一直是股市的一个不佳指标波动性
Volatility: The SKEW Index and Stock Market Crashes
波动性:SKEW指数和股市崩盘
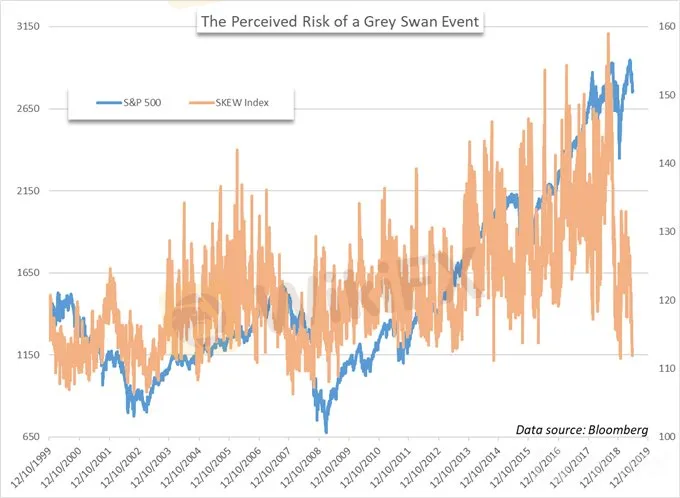
The recent bout of stock market turbulence has seen volatility levels tick higher, but lack a significant surge. On the other hand, one lesser-watched index that seeks to measure the probability of tail-risk events extreme moves higher or more often lower - recently matched its lowest reading from the past decade. The SKEW Index, curated by the Chicago Board of Options Exchange (CBOE), ticked beneath 112 on May 29 – just the third such occurrence since April 2009.
最近一轮股市动荡出现波动水平更高,但缺乏显着的激增。另一方面,一个较少观察的指数旨在衡量尾部风险事件的极端变动概率更高或更低 - 最近与过去十年的最低读数相匹配。由芝加哥期权交易所(CBOE)策划的SKEW指数在5月29日下跌至112以下 - 这是自2009年4月以来的第三次。

The SKEW Index measures the perceived tail-risk in the S&P 500 – based on the implied volatility of out-of-the-money options, whereas the VIX considers the implied volatility of at-the-money options. “Tail risk” is the chance that an event will occur outside one standard deviation from the mean. Given how the Index is derived, it measures the slope of implied volatility – which can then be displayed as the probability of a two or three standard deviation move for the S&P 500 in the next 30 days.
SKEW指数衡量标准普尔500指数中的尾部风险 - 基于价外期权的隐含波动率,而VIX则考虑价内期权的隐含波动率。 “尾部风险”是事件发生在距平均值一个标准偏差之外的可能性。鉴于指数的推导方式,它衡量隐含波动率的斜率 - 然后可以显示为标准普尔500指数在未来30天内移动两到三个标准差的概率。
Will the Stock Market Crash in 2019?
2019年股市崩盘?
That probability is then reflected within a range - typically from 100 to 150 - where a higher reading suggests the market is perceiving greater risk of a Grey Swan event. At 130, there is approximately a 10% chance of the S&P 500 making a two-standard deviation move over the next thirty days – while the probability of a three-standard deviation move is just 2%.
然后这个概率反映在一个范围内 - 通常是100到150 - 更高的读数表明市场认为灰天鹅事件的风险更大。在130,标准普尔500指数大约有10%的可能性为2秒在接下来的三十天里,准备偏差会发生变化 - 而三标准偏差的概率只有2%。

Source: CBOE
Although it attempts to gauge the markets view on tail-risk and financial crashes, it does not provide insight on whether a statistically anomalous event will actually take place. Further, SKEW is a poor indicator of stock market volatility according to historical performance – especially with the Black or Grey Swan events it tries to forecast. Since 2000, the 5-largest single-day draw downs for the S&P 500 had average SKEW reading of 113.53 the day before the decline.
虽然它试图衡量市场对尾部风险和金融崩溃的看法,但它没有提供有关统计上的异常事件是否会实际发生的见解。此外,根据历史表现,SKEW是股市波动性的一个不佳指标 - 尤其是它试图预测的黑色或灰色天鹅事件。自2000年以来,标准普尔500指数的5大单日跌幅在下跌前一天的平均SKEW读数为113.53。

Thus, the SKEW Index provides little value when attempting to gauge these extreme sell-offs. It does however, offer insight on investor sentiment. Like the VIX, SKEW can display heightened levels of investor fear – even without a simultaneous drawdown in price. That said, the notably low reading on May 28 is concerning as the S&P 500 continues to slide – while option traders see little chance of a crash, so much so that it may suggest complacency.
因此,当试图衡量这些极端抛售时,SKEW指数几乎没有价值。然而,它提供了对投资者情绪的洞察力。与VIX一样,SKEW可以显示出更高的投资者恐惧程度 - 即使没有同时降价。也就是说,随着标准普尔500指数继续下滑,5月28日的低读数令人担忧 - 而期权交易商认为崩盘几率很小,以至于可能表明自满情绪。
Disclaimer:
The views in this article only represent the author's personal views, and do not constitute investment advice on this platform. This platform does not guarantee the accuracy, completeness and timeliness of the information in the article, and will not be liable for any loss caused by the use of or reliance on the information in the article.
Read more

S&P 500 Price Outlook: Value Stocks Outperform Momentum, Tech Lags
After breaking outside of its August range, the road higher seemed to be laid out for the S&P 500, but tech and momentum stocks have been largely absent from the rally effort.

S&P 500 Forecast: Stocks Threaten Breakdown as TLT ETF Soars
The S&P 500 fluctuated between losses and gains on Thursday before finishing narrowly higher. Meanwhile, investors continued to clamor for safety in bonds.

Dow Jones, DAX 30, FTSE 100 Forecasts for the Week Ahead
As trade wars and monetary policy look to maintain their position at the helm, markets will be offered insight on another major theme that could rattle fragile sentiment.

S&P 500 Forecast: Stocks Rebound, but will the Recovery Continue?
After plummeting at the open, the S&P 500 mounted a relief effort during Wednesday trading to eventually close in the green. While the rebound was encouraging, can it surmount nearby resistance?
WikiFX Broker
Latest News
The Withdrawal Trap: How Scam Brokers Lure Victims into Paying More
FCA to Investors: Think Twice Before Trusting These Brokers
Trump\s tariffs: How could they affect the UK and your money
Trump gambles it all on global tariffs he\s wanted for decades
TradingView Brings Live Market Charts to Telegram Users with New Mini App
Trump tariffs: How will India navigate a world on the brink of a trade war?
Interactive Brokers Launches Forecast Contracts in Canada for Market Predictions
Authorities Alert: MAS Impersonation Scam Hits Singapore
IG Group Acquires Freetrade for £160M to Expand UK Investment Market
U.S. March ISM Manufacturing PMI Released
Currency Calculator


