简体中文
繁體中文
English
Pусский
日本語
ภาษาไทย
Tiếng Việt
Bahasa Indonesia
Español
हिन्दी
Filippiiniläinen
Français
Deutsch
Português
Türkçe
한국어
العربية
S&P 500 Forecast: Stocks Threaten Breakdown as TLT ETF Soars
Abstract:The S&P 500 fluctuated between losses and gains on Thursday before finishing narrowly higher. Meanwhile, investors continued to clamor for safety in bonds.
S&P 500 Outlook:
Volatility remains abundant as stocks jostled throughout Thursday trading
The S&P 500 was able to eek out a daily close above two technical levels that could provide support headed into next week
Sign up for our Free Weekly Equity Webinar in which critical technical levels and fundamental themes are analyzed each week
S&P 500 Forecast: Stocks Threaten Breakdown as TLT ETF Soars
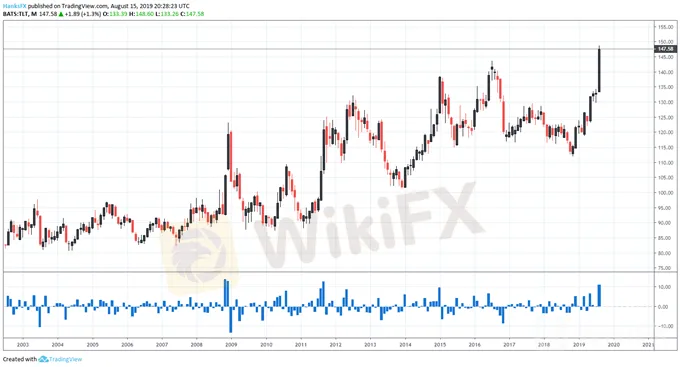
The S&P 500 closed 0.2% higher after paring losses established earlier in the session. While strong earnings from Walmart (WMT) and Alibaba (BABA) helped to stall declines, investors are still wary of an extended recovery – as evidenced by collapsing treasury yields. Consequently, the TLT ETF, which seeks to track the investment results of an index composed of U.S. Treasury bonds with remaining maturities greater than twenty years, touched all-time highs.
TLT ETF Price Chart: Daily Time Frame (2002 – 2019) (Chart 1)

Chart created withTradingView
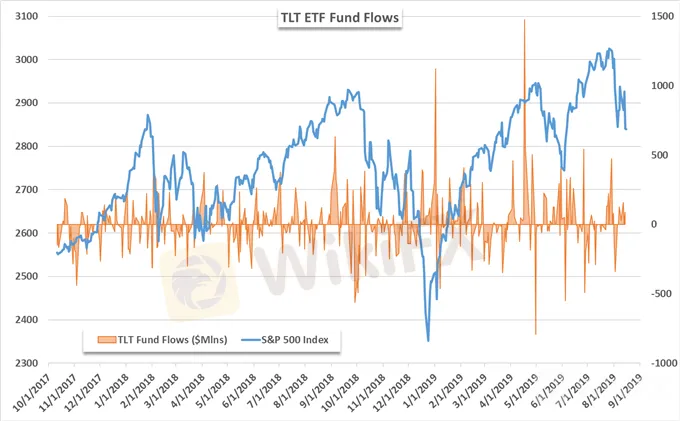
Coinciding with heightened stock market volatility and growing uncertainty about the health of the US economy, the TLT ETF is on pace for its largest 1-month return since September 2011 – with two more full trading weeks. Further, TLT boasts a return of nearly 21% in the year-to-date, now outpacing the S&P 500 and even Nasdaq 100 which have gained 13.5% and 17.8% in 2019 respectively. The continuous demand for safety speaks to the ongoing uncertainty among traders and has resulted in robust capital flows into TLT.

Boasting net inflows of nearly $4.8 billion in 2019, TLT is in the process of posting two-straight weeks of net inflows – despite forecasted Fed rate cuts. While an inversion of the yield curve and soaring demand for TLT paint a bleak picture for the S&P 500, the Index was able to narrowly close above a possible trendline heading into Friday trading. Further, strong earnings from Nvidia (NVDA) could look to bolster the tech sector and Nasdaq 100 as I outlined yesterday.
S&P 500 Price Chart: 4 – Hour Time Frame (June – August) (Chart 2)

Chart created withTradingView
After closing slightly above trendline support from June, traders could use the technical barrier as an excuse – or an opportunity – to explore long positions heading into the weekend. Fibonacci support is also nearby at the 2,840 level and bulls will look for any and all assistance they can get after the last two weeks of turmoil for the SPX. Should risk aversion reignite, subsequent support can be looked to at the 2,800 and 2,740 levels – with various areas of minor buoyance in between.
Disclaimer:
The views in this article only represent the author's personal views, and do not constitute investment advice on this platform. This platform does not guarantee the accuracy, completeness and timeliness of the information in the article, and will not be liable for any loss caused by the use of or reliance on the information in the article.
Read more

【MACRO Alert】The possibility of Trump winning the election is closely linked to market conditions! Could Japan become a big winner from this?
Although the market has responded positively to the prospect of Trump's possible re-election, and the Japanese stock market has shown an upward trend as a result, investors should also remain cautious and pay attention to the long-term impact of the election results on global economic policies and market sentiment. As strategist Tomo Kinoshita pointed out, while short-term market dynamics may be closely related to the election results, ultimately, the fundamentals of companies, economic data, an

Market Focus on Earnings Report
As we head into the second quarter earnings report season, the U.S. equity market is poised to capture significant attention. Recent geopolitical events, particularly the unconfirmed reports of an explosion in Iran's third-largest city last Friday, have injected volatility into commodities prices and bolstered the appeal of safe-haven assets like the U.S. dollar and Japanese Yen.

Daily Market Newsletter - February 8, 2024
Recap of Global Market Trends and Trading Opportunities

S&P 500 Price Outlook: Value Stocks Outperform Momentum, Tech Lags
After breaking outside of its August range, the road higher seemed to be laid out for the S&P 500, but tech and momentum stocks have been largely absent from the rally effort.
WikiFX Broker
Latest News
Forex Market Outlook: Key Currency Pairs and Trading Strategies for March 24–28, 2025
Singapore Police Crack Down on Scams: $1.9M Seized, 25 Arrested
Gold Prices Swing Near Record Highs
XTB Opens New Dubai Office
Africa Cybercrime Bust: Over 300 Arrested in Fraud Crackdown
The Growing Threat of Fake Emails and Phishing Scams
Hong Kong Banks and Authorities Collaborate to Freeze Fraudulent Accounts Faster
SocialFi and the Forex Market: A New Era for Decentralized Social Trading?
Is Billion Bucks Fx Scam?
BaFin Halts USDe Token Issuance, Citing Serious Compliance Failures
Currency Calculator


