简体中文
繁體中文
English
Pусский
日本語
ภาษาไทย
Tiếng Việt
Bahasa Indonesia
Español
हिन्दी
Filippiiniläinen
Français
Deutsch
Português
Türkçe
한국어
العربية
Gold Price Outlook: XAUUSD Pulls Back After a Big Month
Abstract:Gold prices had a big month of June, gaining almost 13% from the May 30 low. But will the second half of 2019 be as friendly to gold bulls?
Gold Price Outlook Talking Points:
黄金价格展望谈话要点: {0} 黄金价格已经在6月份成为炙手可热的月份黄金从5月30日的低点上涨了12.9%。
黄金价格已经在6月份成为炙手可热的月份黄金从5月30日的低点上涨了12.9%。
黄金价格在前六年遇到阻力后开始回落 - 高位,将多头提供高低支持继续上个月的上行主题?
黄金价格在前六年遇到阻力后开始回落 - 高位,将多头提供高低支持继续上个月的上行主题?
黄金价格在寻找阻力后继续回调在之前的六年高点
黄金价格在寻找阻力后继续回调在之前的六年高点
由于价格在整个6月份继续上涨,这个月的每周都有涨Q2的结束。价格走势创下6年新高,突破1439点水平;但此后买家未能获得多大力量,导致黄金价格现在连续三天下跌。退一步,从之前的六年高点到2012 - 2015年重大举措的50%标记产生的阻力区迄今为止一直是黄金看涨突破的高点。
由于价格在整个6月份继续上涨,这个月的每周都有涨Q2的结束。价格走势创下6年新高,突破1439点水平;但此后买家未能获得多大力量,导致黄金价格现在连续三天下跌。退一步,从之前的六年高点到2012 - 2015年重大举措的50%标记产生的阻力区迄今为止一直是黄金看涨突破的高点。
黄金价格每周图表
黄金价格每周图表
图表由James Stanley编写
图表由James Stanley编写
上周三看到的第一个支撑区域的文章自那以来一直无法保持低点,并且在图表上达到1400水平附近,这与上个月看涨的23.6%斐波那契回撤相吻合。额外的支撑潜力存在更深一些,相同的先前移动约38.2和50%的回撤,两者都与先前的价格变动同步以创建感兴趣的汇合区域。
上周三看到的第一个支撑区域的文章自那以来一直无法保持低点,并且在图表上达到1400水平附近,这与上个月看涨的23.6%斐波那契回撤相吻合。额外的支撑潜力存在更深一些,相同的先前移动约38.2和50%的回撤,两者都与先前的价格变动同步以创建感兴趣的汇合区域。
{10} 1357.50附近的区域特别有趣,因为该价格是2018年的高点;在卖家能够控制之前,在1月和4月进行了测试。这非常接近最近一次重大举措的50%标记,该标记出现在1357.14。{1}
Gold prices have capped a riveting month of June as the yellow metal gained as much as 12.9% from the May 30 low.
{1}{2}
Gold prices have started to scale back after finding resistance at prior six-year-highs, will bulls step-in to offer higher-low support to continue last months topside theme?
{2}{3}
Gold Prices Continue to Retrace After Finding Resistance at Prior Six-Year-Highs
{3}
{5}
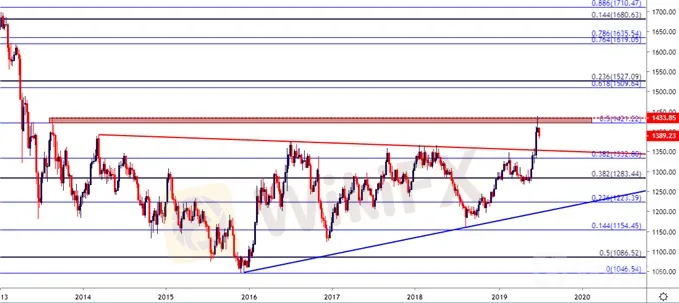
It was a strong month for gold as prices continued to ascend throughout June, with gains each week of the month into the end of Q2. Price action set a fresh six-year-high by breaking-out to the 1439 level; but buyers werent able to muster much strength thereafter, leading to a three, now four-day pullback in gold prices. Taking a step back, and the resistance zone produced from that prior six-year-high to the 50% marker of the 2012-2015 major move has thus far held the highs in the bullish breakout in gold.
{5}{6}
Gold Price Weekly Chart
{6}{7}

Chart prepared by James Stanley
{7}{8}
The first support zone looked at in last Wednesday‘s article has been unable to since hold the lows, and this came in around the 1400 level on the chart which is confluent with the 23.6% Fibonacci retracement of last month’s bullish move. Additional support potential exists a bit deeper, around 38.2 and 50% retracements from that same prior move, both of which sync with prior price inflections to create confluent areas of interest.
{8}
{10}
The area around 1357.50 is particularly interesting, as that price was the 2018 swing high; tested in both January and April before sellers were able to take-control. This is very close to the 50% marker of that recent major move, which comes in at 1357.14.
{10}
Gold Price Eight-Hour Chart
黄金价格八小时图表

Chart prepared by James Stanley
James Stanley编制的图表
{13}
Gold Price on a Short-Term Basis
{13}
Since that resistance came into play last week, gold prices have been on their backfoot, continuing in a pattern of lower-lows and lower-highs. For traders looking at bigger-picture reversals, or for traders looking to treat the matter from a short-term vantage point, there could be some continued scope for further losses on a near-term basis, particularly until the bigger-picture zones of support looked at above might come into play. This opens the door to short-side potential down towards 1375 and then 1357.50. Key for that theme will be a hold of resistance around that 1400 area on the chart, which can keep the door open for short-term bearish trend strategies in Gold.
自上周出现阻力以来,黄金价格一直处于下跌状态,继续走低 - 低点和低点。对于寻求较大幅度逆转的交易者,或者希望从短期有利位置处理此事的交易者,短期内可能存在进一步损失的持续空间,特别是在更大的支撑区域之前看着上面可能会发挥作用。这打开了向短边潜力下行至1375然后至1357.50的大门。该主题的关键在于图表上1400区域的阻力位,这可以为黄金的短期看跌趋势策略敞开大门。
Gold Price Hourly Chart
每小时黄金价格图表

Chart prepared by James Stanley
图表由James Stanley编写
To read more:
阅读更多内容:
Are you looking for longer-term analysis on the U.S. Dollar? Our DailyFX Forecasts have a section for each major currency, and we also offer a plethora of resources on Gold or USD-pairs such as EUR/USD, GBP/USD, USD/JPY, AUD/USD. Traders can also stay up with near-term positioning via our IG Client Sentiment Indicator.
您是否正在寻找对美元的长期分析?我们的DailyFX预测有一个针对每种主要货币的部分,我们还提供了大量有关黄金或美元对的资源,如欧元/美元,英镑/美元,美元/日元,澳元/美元。交易者还可以通过我们的IG客户情绪指标保持近期定位。
Disclaimer:
The views in this article only represent the author's personal views, and do not constitute investment advice on this platform. This platform does not guarantee the accuracy, completeness and timeliness of the information in the article, and will not be liable for any loss caused by the use of or reliance on the information in the article.
Read more

FBS Joins Two Prestigious Financial Events by the End of 2024
FBS is thrilled to announce our participation in two major financial events in Asia – iFX Expo Asia 2024 and Traders Fair Davao!

FBS IB Program Named the Best Globally
The FBS Partnership Program earned the title of the Best Introducing Broker Programme 2024 from the World Finance Awards.

FBS Ranked Among Top 5 Best Brokers by FXStreet
FBS has been recognized as one of the best Forex brokers in 2024 by FXStreet!

FBS Increases Leverage on U.S. Indices to 1:500
FBS is excited to announce a significant update in trading conditions for our clients: starting from August 5th, 2024, the leverage on major U.S. indices, including US30, US100, and US500, is increased from 1:200 to 1:500.
WikiFX Broker
Latest News
The Withdrawal Trap: How Scam Brokers Lure Victims into Paying More
FCA to Investors: Think Twice Before Trusting These Brokers
Trump\s tariffs: How could they affect the UK and your money
Trump gambles it all on global tariffs he\s wanted for decades
TradingView Brings Live Market Charts to Telegram Users with New Mini App
Trump tariffs: How will India navigate a world on the brink of a trade war?
Interactive Brokers Launches Forecast Contracts in Canada for Market Predictions
Authorities Alert: MAS Impersonation Scam Hits Singapore
Stocks fall again as Trump tariff jitters continue
IG Group Acquires Freetrade for £160M to Expand UK Investment Market
Currency Calculator


