简体中文
繁體中文
English
Pусский
日本語
ภาษาไทย
Tiếng Việt
Bahasa Indonesia
Español
हिन्दी
Filippiiniläinen
Français
Deutsch
Português
Türkçe
한국어
العربية
Gold Prices May Fall as the Fed Falls Short of Dovish Market Hopes
Abstract:Gold prices may fall – making good on technical clues pointing to topping – as the Federal Reserve shies away from endorsing the markets ultra-dovish policy outlook.
GOLD & CRUDE OIL TALKING POINTS:
Gold prices stalling but overall technical positioning hints at topping
Fed policy outlook unlikely to match ultra-dovish market expectations
Crude oil may fall with stocks as US Dollar gains pressure gold lower
Gold prices await the Fed monetary policy announcement with bated breath. The central bank is widely expected to deliver an interest rate cut, with markets pricing in an 80 percent probability of a 25bps reduction and a 20 percent chance of a 50bps one.
A smaller dose of stimulus this time around seems more likely. Core inflation is not too far off from the Fed‘s 2 percent goal and the jobless rate still hovers near a 50-year low, suggesting that easing here is – by key officials’ own admission – a preemptive move to counter gathering headwinds.
Such an outcome probably isnt market-moving by itself, putting the focus on forward guidance. Rate futures markets imply investors see Jerome Powell and company producing between 50-75bps in stimulus on top of ending the QT balance sheet reduction effort, all before year-end.
The US central bank is unlikely to endorse this vision. Indeed, much of Chair Powells rhetorical pivot and structural reform agenda since taking office – like having a press conference after every FOMC meeting – have focused on moving away from long-form pre-commitment to a nimbler approach.
That is likely to leave the markets wanting, souring risk appetite and punishing sentiment-linked crude oil prices alongside stocks. It may also drive the US Dollar higher, both on haven-seeking grounds and as follow-on rate cut bets are trimmed. That bodes decidedly ill for anti-fiat gold.
Get the latest gold and crude oil forecasts to see what will drive prices in the third quarter!
GOLD TECHNICAL ANALYSIS
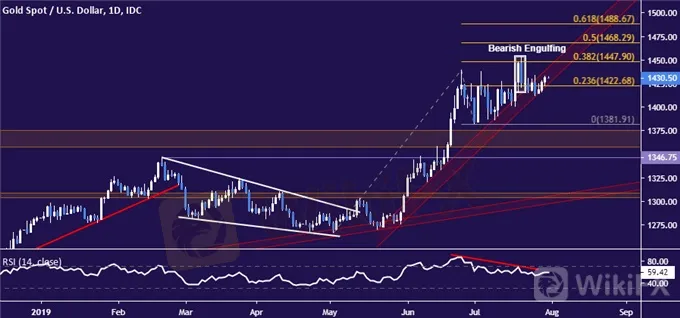
Gold prices continue to cling to rising trend support but a Bearish Engulfing candlestick pattern along with negative RSI divergence hint a top is forming. A daily close below the trend line initially exposes the July 1 low at 1381.91. On the upside, a break of the 38.2% Fibonacci expansion at 1447.90 paves the way to challenge the 50% level at 1468.29.

Gold chart created using TradingView
CRUDE OIL TECHNICAL ANALYSIS
Crude oil prices rose to challenge range resistance at 58.19 but stopped conspicuously short of breaking it. A daily close above it opens the door for a test of the 60.04-84 area.Alternatively, a turn below range floor support at 54.84 targets the 49.41-50.60 zone.

Crude oil chart created using TradingView
COMMODITY TRADING RESOURCES
See our guide to learn about the long-term forces driving crude oil prices
Having trouble with your strategy? Heres the #1 mistake that traders make
Join a free webinar and have your commodity market questions answered
Disclaimer:
The views in this article only represent the author's personal views, and do not constitute investment advice on this platform. This platform does not guarantee the accuracy, completeness and timeliness of the information in the article, and will not be liable for any loss caused by the use of or reliance on the information in the article.
Read more

Weekly Analysis: XAU/USD Gold Insights
Gold prices have been highly volatile, trading near record highs due to various economic and geopolitical factors. Last week's weak US employment data, with only 114,000 jobs added and an unexpected rise in the unemployment rate to 4.3%, has increased the likelihood of the Federal Reserve implementing rate cuts, boosting gold's appeal. Tensions in the Middle East further support gold as a safe-haven asset. Technical analysis suggests that gold prices might break above $2,477, potentially reachin

USDJPY Predicted to Rise on Yen Depreciation
The USD/JPY pair is predicted to increase based on both fundamental and technical analyses. Fundamental factors include a potential easing of aggressive bond buying by the Bank of Japan (BoJ), which could lead to yen depreciation. Technical indicators suggest a continuing uptrend, with the possibility of a correction once the price reaches the 157.7 to 160 range.

Stocks Dip, Bitcoin Surges, Euro Weakens | Daily Market Update
Tech Stocks Under Pressure, Inflation Data Looms

Beginner Tips for Gold Technical Analysis - Forex4you
Are you interested in trading gold? Forex4you will provide you 6 tips for gold technical analysis, which each beginner or novice should know.
WikiFX Broker
Latest News
Interactive Brokers Launches Forecast Contracts in Canada for Market Predictions
Authorities Alert: MAS Impersonation Scam Hits Singapore
INFINOX Partners with Acelerador Racing for Porsche Cup Brazil 2025
Billboard Warns of Crypto Scams Using Its Name – Stay Alert!
The Impact of Interest Rate Decisions on the Forex Market
STARTRADER Spreads Kindness Through Ramadan Campaign
Rising WhatsApp Scams Highlight Need for Stronger User Protections
A Trader’s Worst Mistake: Overlooking Broker Reviews Could Cost You Everything
How a Housewife Lost RM288,235 in a Facebook Investment Scam
The Daily Habits of a Profitable Trader
Currency Calculator


