简体中文
繁體中文
English
Pусский
日本語
ภาษาไทย
Tiếng Việt
Bahasa Indonesia
Español
हिन्दी
Filippiiniläinen
Français
Deutsch
Português
Türkçe
한국어
العربية
US Dollar Price Action Setups: EURUSD, GBPUSD, USDCAD, USDCHF
Abstract:The Equity sell-off has calmed for now but a number of questions remain around global markets. The US Dollar is currently testing lower-high resistance.
US Dollar Talking Points:
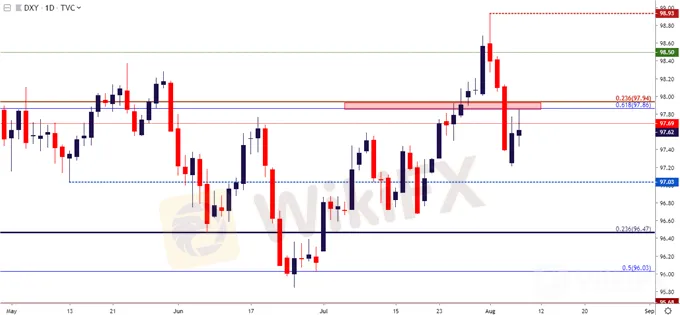
Last weeks price action in the USD produced an inverted hammer formation, and given the area on the chart where this took place, the potential for bearish price action remains of interest.
DailyFX Forecasts are published on a variety of markets such as Gold, the US Dollar or the Euro and are available from the DailyFX Trading Guides page. If you‘re looking to improve your trading approach, check out Traits of Successful Traders. And if you’re looking for an introductory primer to the Forex market, check out our New to FX Guide.
US Dollar Pulls Back to Fibonacci Resistance
Its been a busy week around the US Dollar and a number of setups remain of interest. While the equity sell-off that started last week on the heels of the additional tariffs levied on China has calmed, currency markets continue to highlight volatility potential and this brings a few areas of interest to the table.
{7}
In the US Dollar, last weeks price action showed as an inverted hammer, which will often be approached with the aim of bearish reversals. That theme continued through Monday trade and the USD found support later in the session, and at this point, the US Dollar is showing near-term resistance underneath two key Fibonacci levels of interest.
{7}
US Dollar Daily Price Chart: Bounce up to Resistance

Chart prepared by James Stanley; US Dollar on Tradingview
EUR/USD Re-Tests Key Resistance Zone After Last Weeks Bounce
The European Central Bank made overtures towards future rate cuts and perhaps even another round of QE at their recent rate decision. This theme may have been a little lost in the shuffle, however, given the events of the past couple of weeks. But – notable is how the currency broke down to a fresh two-year-low on the heels of the FOMC rate cut, when the US Dollar was really strong, and this may keep open the bearish drive as the ECB has, at the least, talked up future dovish policy options.
At this point, EUR/USD is coming off of a resistance test of the big zone thats been in-play since last November. This runs from 1.1187-1.1212; and takes place after a rejection at a deeper resistance zone that runs from 1.1248-1.1262. For swing strategies, this can open the door for short-side approaches. For shorter-term strategies, watching the 1.1187 level for near-term higher-low support can open the door on the long side of the move, looking for a deeper retracement towards 1.1250 or, perhaps even 1.1325.
EUR/USD Daily Price Chart

Chart prepared by James Stanley; EURUSD on Tradingview
GBPUSD Bulls Dont Make Much Ground After Trendline Comes into Play
July price action produced a blistering string of losses for the British Pound, and the currency still has yet to recover. About the most positive thing that could be said here is that against the US Dollar, at the very least, the currency has stopped declining, at least for now. Last week saw a long-term trendline come into play around the 1.2100 handle, and this is taken from extreme lows ahead of the Plaza Accord in 1985 and the flash crash after the Brexit referendum in 2016.
{17}
GBP/USD Monthly Price Chart
{17}

Chart prepared by James Stanley; GBPUSD on Tradingview
{19}
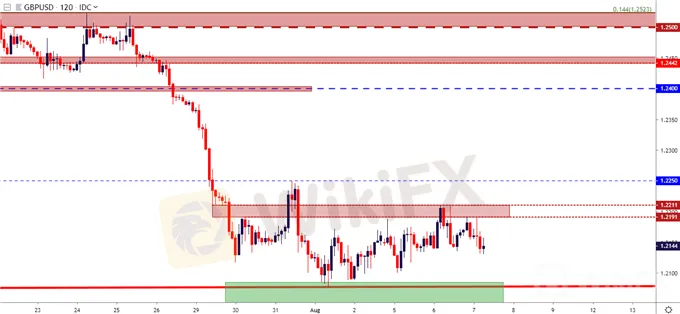
After coming into the equation last week on the heels of the FOMC, prices have yet to punch down to a fresh low, but sellers haven‘t exactly went away. There’s been a build of resistance in the zone looked at last Thursday that runs from 1.2191-1.2211. This could keep the door open for short-side approaches but, as looked at yesterday, this waning bearishness at lows may be preluding a deeper retracement move before the bigger-picture short-side theme is ready for continuation.
GBP/USD Two-Hour Price Chart: Long-Term Trendline Bounce into Resistance

Chart prepared by James Stanley; GBPUSD on Tradingview
USD/CAD Bursts up to 1.3300 as Bullish Reversal Continues
The month of June was brutal for USD/CAD. As a more dovish Fed was getting priced-in, the CAD was really strong on the back of higher-than-expected inflation. This led to a spiraling effect in the pair as USD/CAD dropped from a late-May print above 1.3500 all the way down towards the 1.3000 handle in mid-July.
But, as looked at a few weeks ago, that selling started to slow, and that led into the build of a falling wedge formation. The reversal then began to take-hold, and it hasnt really stopped since. Prices in USD/CAD are now trading at fresh seven-week-highs, testing above a key zone of resistance that runs from 1.3250-1.3300. A bit-higher is another zone of interest that runs from 1.3361-1.3385 which, if it comes into play and shows resistance, may open the door for short-side swing approaches.
USD/CAD Eight-Hour Price Chart

Chart prepared by James Stanley; USDCAD on Tradingview
USD/CHF Pulled Back but Which Way Will the Slingshot Break?
USD/CHF has also been of interest on the short side of the US Dollar lately, and last weeks re-emergence of USD selling helped to drive USD/CHF down for a re-test of 2019 lows. At this point, that support has held this third test of the .9715 area, but sellers have shown back up at the .9800 level. For those looking at a re-emergence of USD-weakness, this could be an area of interest in the coming days, watching for a break through the .9700 level.
USD/CHF Daily Price Chart: Knocking on the Door for Fresh 2019 Lows

Disclaimer:
The views in this article only represent the author's personal views, and do not constitute investment advice on this platform. This platform does not guarantee the accuracy, completeness and timeliness of the information in the article, and will not be liable for any loss caused by the use of or reliance on the information in the article.
Read more

FBS Joins Two Prestigious Financial Events by the End of 2024
FBS is thrilled to announce our participation in two major financial events in Asia – iFX Expo Asia 2024 and Traders Fair Davao!

FBS IB Program Named the Best Globally
The FBS Partnership Program earned the title of the Best Introducing Broker Programme 2024 from the World Finance Awards.

FBS Ranked Among Top 5 Best Brokers by FXStreet
FBS has been recognized as one of the best Forex brokers in 2024 by FXStreet!

FBS Increases Leverage on U.S. Indices to 1:500
FBS is excited to announce a significant update in trading conditions for our clients: starting from August 5th, 2024, the leverage on major U.S. indices, including US30, US100, and US500, is increased from 1:200 to 1:500.
WikiFX Broker
Latest News
Exposing the Top 5 Scam Brokers of March 2025: A Closer Look by WikiFX
Gold Prices Climb Again – Have Investors Seized the Opportunity?
Webull Launches SMSF Investment Platform with Zero Fees
Australian Regulator Warns of Money Laundering and Fraud Risks in Crypto ATMs
The Withdrawal Trap: How Scam Brokers Lure Victims into Paying More
FCA to Investors: Think Twice Before Trusting These Brokers
Trump\s tariffs: How could they affect the UK and your money
Trump gambles it all on global tariffs he\s wanted for decades
HTFX Spreads Joy During Eid Charity Event in Jakarta
How Will the Market React at a Crucial Turning Point?
Currency Calculator


