简体中文
繁體中文
English
Pусский
日本語
ภาษาไทย
Tiếng Việt
Bahasa Indonesia
Español
हिन्दी
Filippiiniläinen
Français
Deutsch
Português
Türkçe
한국어
العربية
S&P 500 Price Targets: SPX Consolidation Levels – Technical Trade Outlook
Abstract:The S&P 500 remains within a broad consolidation level just below a key pivot zone weve been tracking for weeks. These are the levels that matter on the SPX500 charts.
S&P 500 in consolidation below key resistance pivot at 2930- pendingbreakout
Join Michael for Live Weekly Strategy Webinars on Mondays at 12:30GMT
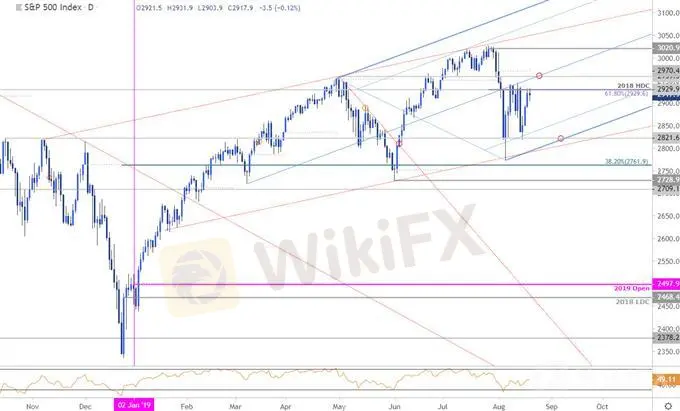
SPX has been trading within a narrowing range since the multi-month lows registered in early August with the recent advance failing at the upper bounds of this pattern today. These are the updated targets and invalidation levels that matter on the SPX500 charts this week. Review this my latest Strategy Webinar for an in-depth breakdown of this gold trade setup and more.
S&P 500 Price Chart – SPX500 Daily

Chart Prepared by Michael Boutros, Technical Strategist; SPX500 on Tradingview
Technical Outlook: The S&P 500 remains in consolidation after probing fresh two-month lows early in August trade. Initial daily resistance stands at 2930- a region defined by the 61.8% retracement of late-July decline and the 2018 high-day close. The index is trading within a broad ascending pitchfork formation extending off the March low with the 25% parallel catching the lows late-last week.
Price remains in a broad consolidation pattern since the monthly low and were looking for the break for guidance. A topside breach exposes the median-line / May high around ~2960 with a close above monthly open resistance at 2970 needed to mark resumption of the broader uptrend. Daily support steady at 2822 with broader bullish invalidation at the lower parallel, currently ~2800.
S&P 500 Price Chart – SPX500 120min

Notes: A closer look at SPX500 price action highlights the recent consolidation pattern with the index turning at confluence resistance at 1229/30. Initial support rests with the 23.6% retracementat 2904 – a break there would expose 2888 and a key zone at 2861/68- look for a bigger reaction there IF reached.
A topside breach would still have to deal with the July trendline (currently ~2940s) with a close above exposing the May high at 2959 and the 100% ext of the monthly advance at 2988- area of interest for possible topside exhaustion IF reached.
Bottom line: The S&P 500 is at the upper bounds of a broad consolidation pattern and leaves the immediate advance vulnerable near-term while below the 8/13 swing highs. From a trading standpoint, a good spot to reduce long-exposure / raise protective stops. Only targeting levels within this range for now- Id be on the lookout for possible exhaustion on a test higher / false breakout before turning- keep in mind the annual Jackson Hole Economic Symposium is on tap this week.
S&P 500 Trader Sentiment

A summary of IG Client Sentiment shows traders are net-short SPX500- the ratio stands at -2.4 (29.4% of traders are long) – bullishreading
Long positions are4.1% lower than yesterday and 3.6% higher from last week
Short positions are11.8% higher than yesterday and 0.4% higher from last week
We typically take a contrarian view to crowd sentiment, and the fact traders are net-short suggests SPX500 prices may continue to rise. Traders are further net-short than yesterday & last week, and the combination of current positioning and recent changes gives us a stronger SPX500-bullish contrarian trading bias from a sentiment standpoint.
---
Active Trade Setups
Gold Price Targets: XAU/USD Bulls on a Break– Technical Trade Outlook
Canadian Dollar Price Targets: USD/CAD Bulls Eye Key Resistance Pivot
Silver Price Targets: XAG/USD Hits Trend Resistance at Yearly Highs
US Dollar Price Outlook: DXY Threatens Larger Recovery– Trade Targets
Euro Technical Price Outlook: EUR/USD Near-term Breakout Imminent
Disclaimer:
The views in this article only represent the author's personal views, and do not constitute investment advice on this platform. This platform does not guarantee the accuracy, completeness and timeliness of the information in the article, and will not be liable for any loss caused by the use of or reliance on the information in the article.
Read more

Saxo Enables Trading with 9 Crypto-FX Trading Pair on TradingView
The broker generated a turnover of $2.5 billion from crypto trading till last month.

EUR/USD Price Analysis: Downside bias remains intact, 1.1250 likely at risk
EUR/USD looks south, with 1.1250 at risks amid firmer USD, yields. Bearish RSI supports the potential move lower towards 1.1200. 1.1300 is the level to beat for the EUR bulls for any meaningful recovery.
Fed Expected to Keep Risk Appetite Running After ECB, Trade Wars
The fundamental pressure will not ease up over the coming week, but momentum behind a distinct trend is not guaranteed. Risk appetite has benefit an improved view of trade wars and the help offered by the ECB but will these themes hold through a more crowded monetary policy gauntlet in

Dow Jones, DAX 30, FTSE 100, S&P 500 Forecasts for the Week
The Dow Jones, DAX 30, FTSE 100 and S&P 500 may look to melt higher ahead of a monumental Fed meeting on Wednesday, but will past peaks look to rebuke a continuation higher?
WikiFX Broker
Latest News
How Crypto Trading Transforms FX and CFD Brokerage Industry
UK would not hesitate to retaliate against US tariffs - No 10 sources
FCA Warns Against 10 Unlicensed or Clone Firms
CySEC Warns Against 14 Unlicensed Investment Websites
Navigating the Intersection of Forex Markets, AI Technology, and Fintech
Exposed: Deceptive World of Fake Trading Gurus – Don’t Get Fooled!
AI-Powered Strategies to Improve Profits in Forex Trading
The One Fear That’s Costing You More Than Just Profits
Currency Calculator


