简体中文
繁體中文
English
Pусский
日本語
ภาษาไทย
Tiếng Việt
Bahasa Indonesia
Español
हिन्दी
Filippiiniläinen
Français
Deutsch
Português
Türkçe
한국어
العربية
Nasdaq 100 Price Forecast: Index Retakes September Peaks but Gaps Loom
Abstract:The Nasdaq 100 climbed higher on Wednesday to cement its status above the peaks from September 2018. Looking ahead, a continuation higher seems possible, but open air beneath looms large.
Nasdaq 100 Price Forecast:
A huge gap higher on Monday allowed the Nasdaq 100 to surpass key resistance around 7,700
Still, the tech-heavy Index enters the latter half of the week with significant open air beneath and if fundamental developments disappoint, the gaps could accelerate losses
Interested in equities? Check out the DailyFX Podcast with Andrew Milligan, head of global strategy at Aberdeen Standard Investments
Nasdaq 100 Forecast: Index Retakes September Peaks but Gaps Loom
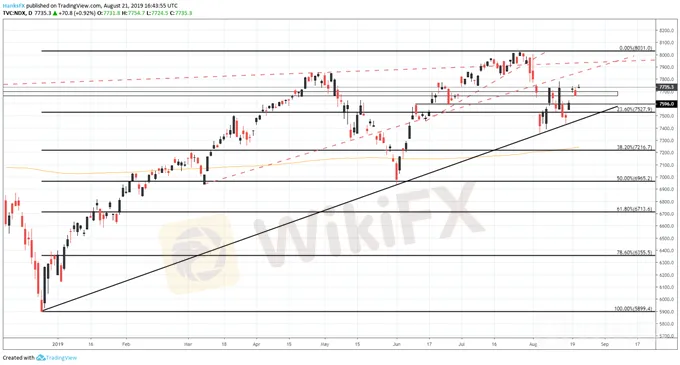
After a hearty gap higher on Monday, the Nasdaq 100 retook the 7,700 level which marks prior peaks in September 2018. A brief retracement on Tuesday threatened those gains, but outstanding earnings from Target and Lowe‘s allowed it to retain them in Wednesday trading. That said, Monday’s gap leaves significant unfilled space beneath current levels and with an economic calendar packed with fundamental event risk, those gaps could look to accelerate losses if monetary policy remarks miss the markets lofty expectations.
Nasdaq 100 Price Chart: Daily Time Frame (December 2018 – August 2019) (Chart 1)

Chart created withTradingView
Therefore, 7,700 will be the initial level to watch for support if bearishness takes hold. Should the support give way, traders could look to fill the gap beneath which could see the Nasdaq quickly slip to 7,623 where minor support may assist bulls around 7,596. Slightly lower still, a confluence of support will look to rebuke bears around the 7,527 where a Fibonacci level intersects the ascending trendline from December.
Sign up for our Free Weekly Equity Webinar in which critical technical levels and fundamental themes are analyzed each week.
If, on the other hand, the July FOMC minutes or the Jackson Hole Symposium offer a positive surprise regarding the outlook of monetary policy, traders will likely use the remarks as fuel for a continuation higher. Initial resistance of note should be offered by the ascending trendline from March. While it has been broken numerous times, a gap beneath in early August suggests the area still holds some influence. A continuation higher will first need to overcome the level before it can target subsequent resistance around 7,935 and eventually all-time highs slightly above 8,000.
Nasdaq 100 Price Chart: 4 – Hour Time Frame (March – August) (Chart 2)

Chart created withTradingView
Disclaimer:
The views in this article only represent the author's personal views, and do not constitute investment advice on this platform. This platform does not guarantee the accuracy, completeness and timeliness of the information in the article, and will not be liable for any loss caused by the use of or reliance on the information in the article.
Read more

【MACRO Alert】The possibility of Trump winning the election is closely linked to market conditions! Could Japan become a big winner from this?
Although the market has responded positively to the prospect of Trump's possible re-election, and the Japanese stock market has shown an upward trend as a result, investors should also remain cautious and pay attention to the long-term impact of the election results on global economic policies and market sentiment. As strategist Tomo Kinoshita pointed out, while short-term market dynamics may be closely related to the election results, ultimately, the fundamentals of companies, economic data, an

Market Focus on Earnings Report
As we head into the second quarter earnings report season, the U.S. equity market is poised to capture significant attention. Recent geopolitical events, particularly the unconfirmed reports of an explosion in Iran's third-largest city last Friday, have injected volatility into commodities prices and bolstered the appeal of safe-haven assets like the U.S. dollar and Japanese Yen.

Daily Market Newsletter - February 8, 2024
Recap of Global Market Trends and Trading Opportunities

Gold Price Forecast: XAU/USD surges above $1,800 on falling US T-bond yields
Gold advances firmly, as US-10 year T-bond yields drop ten basis points, down to 1.43%. Risk-off market sentiment boosted the prospects of the XAU/USD, as the COVID-19 omicron variant threatens to derail the economic growth. XAU/USD Technical outlook: A break above $1,807 would expose $1,815, followed by $1,834.
WikiFX Broker
Latest News
How Crypto Trading Transforms FX and CFD Brokerage Industry
UK would not hesitate to retaliate against US tariffs - No 10 sources
Navigating the Intersection of Forex Markets, AI Technology, and Fintech
Exposed: Deceptive World of Fake Trading Gurus – Don’t Get Fooled!
The One Fear That’s Costing You More Than Just Profits
Currency Calculator


