简体中文
繁體中文
English
Pусский
日本語
ภาษาไทย
Tiếng Việt
Bahasa Indonesia
Español
हिन्दी
Filippiiniläinen
Français
Deutsch
Português
Türkçe
한국어
العربية
How to Use Past Price for Estimating the Next Step
Abstract:How Forex traders can use the charts as a road map to figure out the most likely price path?
How Forex traders can use the charts as a road map to figure out the most likely price path?
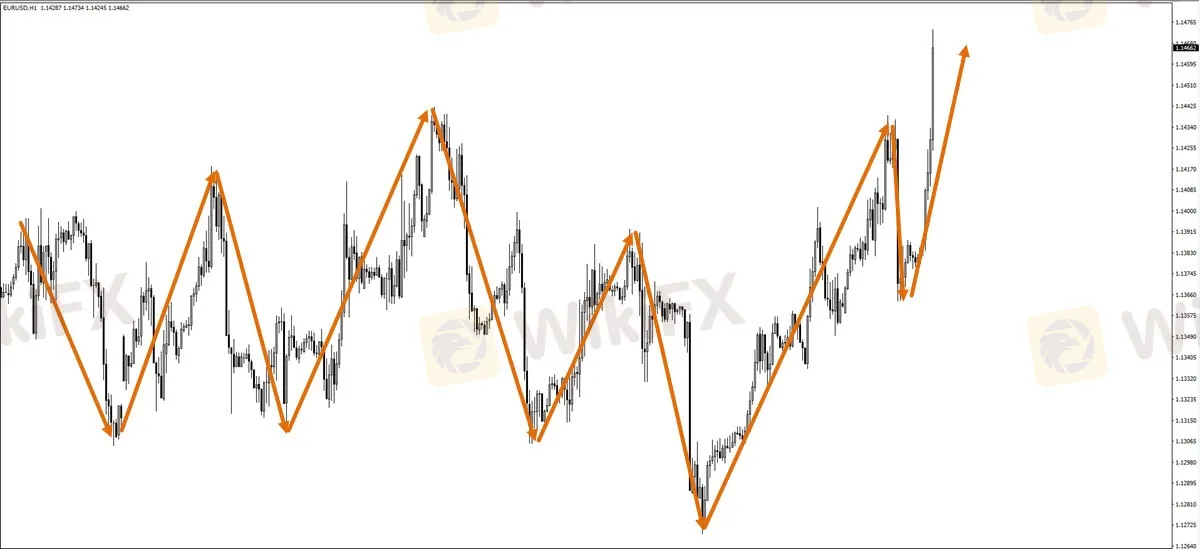
Supply and demand leaves a trail on the chart (past price). Traders can analyse that trail (price movement) and use it as a road map to understand what the next price movement could be. Analysing past price (past path of least resistance) helps traders estimate and forecast what the next step or two could be. Based on that, traders can then assess whether there are any interesting potential trade setups within that expected path.
The financial markets in general and the Forex market in specific are in a continuous tug of war between sellers and buyers (supply and demand). This creates price waves that are visible on almost all charts.

Disclaimer:
The views in this article only represent the author's personal views, and do not constitute investment advice on this platform. This platform does not guarantee the accuracy, completeness and timeliness of the information in the article, and will not be liable for any loss caused by the use of or reliance on the information in the article.
WikiFX Broker
Latest News
CySEC Warns Against Unauthorized Investment Firms in Cyprus
Why Even the Highly Educated Fall Victim to Investment Scams?
Warning Against Globalmarketsbull & Cryptclubmarket
Dukascopy Bank Expands Trading Account Base Currencies
UK Sets Stage for Stablecoin Regulation and Staking Exemption
Axi Bids AUD 52M to Acquire Low-Cost Broker SelfWealth, Outbidding Competitor Bell Financial
Crypto Influencer's Body Found Months After Kidnapping
STARTRADER Issues Alerts on Fake Sites and Unauthorized Apps
Italy’s CONSOB Blocks Seven Unregistered Financial Websites
Bitfinex Hacker Ilya Lichtenstein Sentenced to 5 Years in Prison
Currency Calculator


