简体中文
繁體中文
English
Pусский
日本語
ภาษาไทย
Tiếng Việt
Bahasa Indonesia
Español
हिन्दी
Filippiiniläinen
Français
Deutsch
Português
Türkçe
한국어
العربية
EUR/JPY Price: Will There Be Further Price Declination to $127.3 Level?
Abstract:EUR/JPY Price: Will There Be Further Price Declination to $127.3 Level?
EUR/JPY bounces off $130.7 resistance level

EUR/JPY Price Analysis – March 26
Further increase in the Bears pressure may penetrate the support level of $128.2 downside, in which the price level of $127.3 and $126.4 may be reached. Should the Bulls defend the support level of $128.2, the bulls may resume and push the pair towards the resistance level of $129.1, $129.8 and $130.7.
EUR/JPY MarketKey Levels:
Supply levels: $129.1, $129.8, $130.7
Demand levels: $128.2, $127.3, $126.4
EUR/JPY Long-term Trend: Bearish
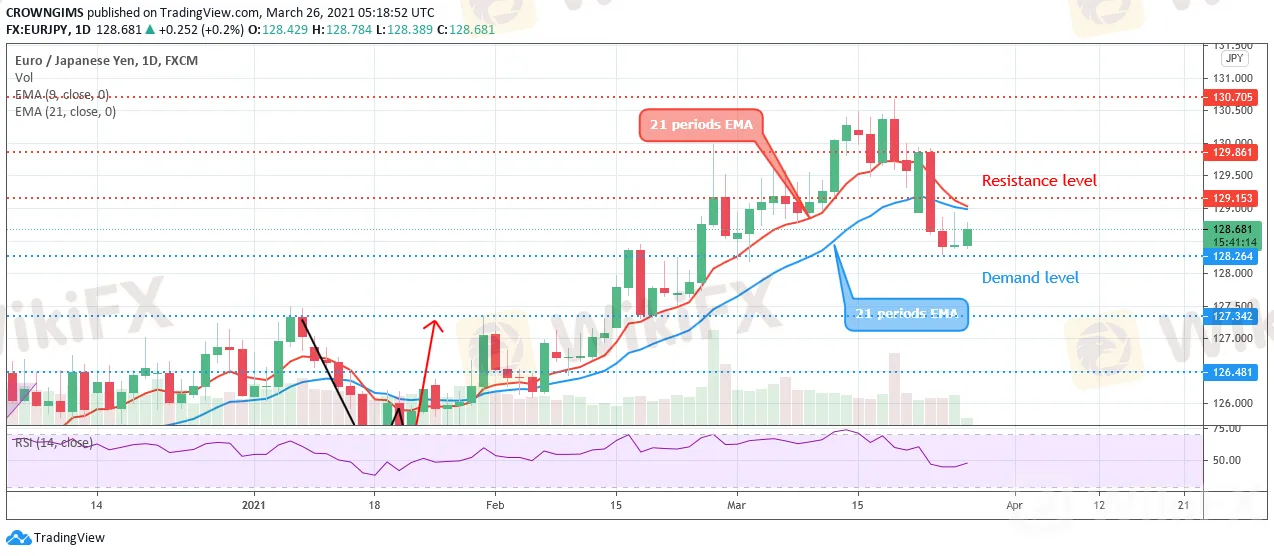
On the long-term outlook, EUR/JPY is bearish. EURJPY currency pair found resistance at $130.7 after several days of bullish trend. A strong bearish candle emerges and the support level of $129.1 and $129.8 was penetrated. Another bearish engulfing candle formed on March 23 and the price reached the support level of $128.2.

EUR/JPY Daily Chart, march 26
The fast moving average is trying to cross the slow moving average while the price is trading below the 9 periods EMA and 21 periods EMA which indicate that bears are dominating the market. Further increase in the Bears pressure may penetrate the support level of $128.2 downside, in which the price level of $127.3 and $126.4 may be reached. Should the Bulls defend the support level of $128.2, the bulls may resume and push the pair towards the resistance level of $129.1, $129.8 and $130.7. The relative strength index period 14 is pointing up to indicate buy signal which may be a pullback.
EURJPY medium-term Trend: Bearish
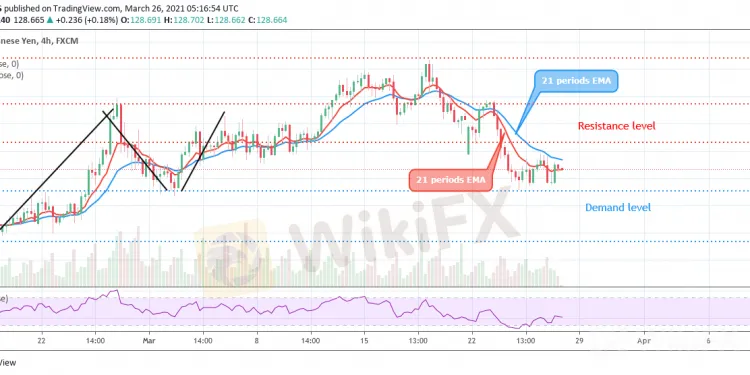
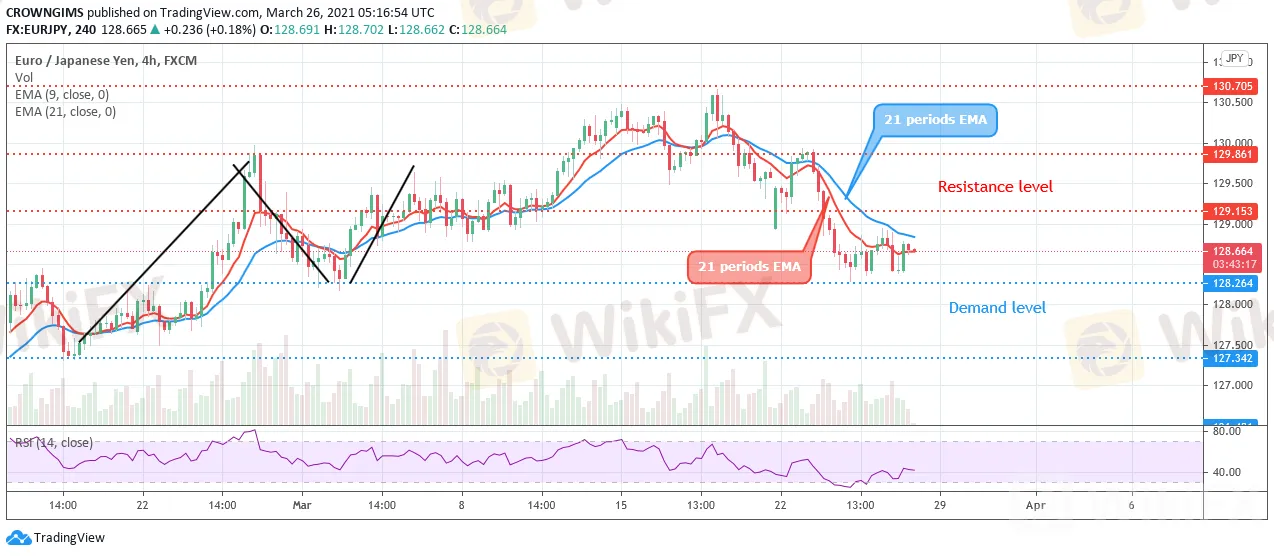
On the 4-hour chart, EUR/JPY is bearish. The bears eventually take over the EURJPY market as it was predicted last week on 4-hour chart. Having said that the bullish momentum became weak when it reaches the resistance level of the $128 zone. The bears pressure increases and the price decline towards the $128.2 after it penetrate the $129.1 level.

EUR/JPY 4-hour chart, May 26
The price is trading below 9 periods EMA and 21 periods EMA and the relative strength index period 14 is at 40 levels with the signal line pointing down to indicate a sell signal.
----------------
WikiFX, the world's No.1 broker inquiry platform!
Use WikiFX to get free trading strategies, scam alerts, and experts experience!
Android : cutt.ly/Bkn0jKJ
iOS : cutt.ly/ekn0yOC

Disclaimer:
The views in this article only represent the author's personal views, and do not constitute investment advice on this platform. This platform does not guarantee the accuracy, completeness and timeliness of the information in the article, and will not be liable for any loss caused by the use of or reliance on the information in the article.
WikiFX Broker
Latest News
The Withdrawal Trap: How Scam Brokers Lure Victims into Paying More
FCA to Investors: Think Twice Before Trusting These Brokers
Trump\s tariffs: How could they affect the UK and your money
Trump gambles it all on global tariffs he\s wanted for decades
TradingView Brings Live Market Charts to Telegram Users with New Mini App
Trump tariffs: How will India navigate a world on the brink of a trade war?
Interactive Brokers Launches Forecast Contracts in Canada for Market Predictions
IG Group Acquires Freetrade for £160M to Expand UK Investment Market
U.S. March ISM Manufacturing PMI Released
Should You Beware of Forex Trading Gurus?
Currency Calculator


