简体中文
繁體中文
English
Pусский
日本語
ภาษาไทย
Tiếng Việt
Bahasa Indonesia
Español
हिन्दी
Filippiiniläinen
Français
Deutsch
Português
Türkçe
한국어
العربية
US Dollar Analysis, Looking Vulnerable: USD/SGD, USD/THB, USD/IDR, USD/PHP
Abstract:US Dollar Analysis, Looking Vulnerable: USD/SGD, USD/THB, USD/IDR, USD/PHP
US Dollar is looking vulnerable against ASEAN currencies
USD/SGD took out key inflection zone, USD/THB topping?
USD/IDR eyes Rising Wedge, USD/PHP to key support zone
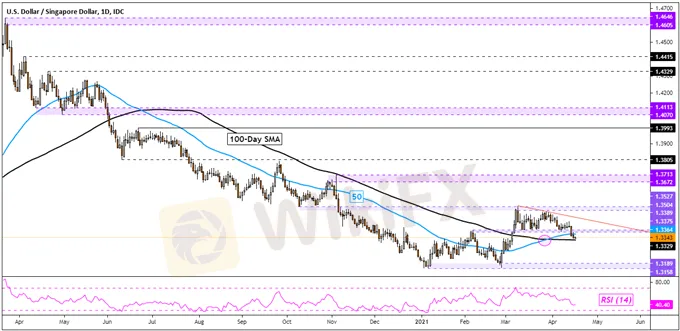
The US Dollar could be vulnerable to the Singapore Dollar. USD/SGD recently confirmed a break under the 1.3375 – 1.3389 inflection zone, also taking out the 50-day Simple Moving Average. That has placed the focus on the 100-day SMA which if taken out, could open the door to revisiting the 1.3158 – 1.3189 support zone. Having said that, there was a bullish crossover between these moving averages. A bounce and push back above the inflection zone exposes near-term falling resistance from March.
USD/SGD DAILY CHART
Chart Created in TradingView
THAI BAHT TECHNICAL OUTLOOKThe US Dollar may also be at risk to the Thai Baht. USD/THB recently left behind a Shooting Star candlestick pattern. When these appear at tops, it is often a sign of indecision. Subsequent downside closes could open the door to a reversal. That appears to have been set in motion here, especially after the presence of negative RSI divergence. While the pair took out the 20-day SMA, another confirmatory close under could open the door to a broader pullback, perhaps one that takes USD/THB to the 50-day SMA. Getting there does involve taking out the 38.2% Fibonacci retracement at 31.0633.
USD/THB DAILY CHART
Chart Created in TradingView
INDONESIAN RUPIAH TECHNICAL OUTLOOKThe US Dollar appears to be trading within a bearish Rising Wedge against the Indonesian Rupiah. If USD/IDR manages to break under the wedge, with confirmation, that may open the door to a near-term pullback. However. The pair did take out the 14525 – 14563 inflection zone, exposing peaks from August 2020. Negative RSI divergence does warn that a turn lower may be in the cards. A material pullback could open the door to testing the 50-day SMA. It could reinstate the focus to the upside.
USD/IDR DAILY CHART

Chart Created in TradingView
PHILIPPINE PESO TECHNICAL OUTLOOKThe US Dollar remains in a fairly consolidate state against the Philippine Peso. Having said that, USD/PHP is once against pressuring the key 48.35 – 48.40 support zone. A break under the 50-day SMA may also be confirmed, opening the door to revisiting lows from earlier this year. That would place the focus on the 47.67 – 47.86 support zone. Otherwise, a bounce could open the door to retesting the key 48.82 – 48.99 resistance zone.
USD/PHP DAILY CHART
Chart Created in TradingView
=================
WikiFX, a global leading broker inquiry platform!
Use WikiFX to get free trading strategies, scam alerts, and experts experience!
╔═══════════════════════╗
Android : cutt.ly/Bkn0jKJ
iOS : cutt.ly/ekn0yOC
╚═══════════════════════╝

Disclaimer:
The views in this article only represent the author's personal views, and do not constitute investment advice on this platform. This platform does not guarantee the accuracy, completeness and timeliness of the information in the article, and will not be liable for any loss caused by the use of or reliance on the information in the article.
Read more

Inflation hot at 13-year high, what will happen to gold?
Inflation hot at 13-year high, what will happen to gold?

Optimism Ahead Of Bank Of Canada Decision
Optimism Ahead Of Bank Of Canada Decision

FX Week Ahead - Top 5 Events: Chinese, Mexican, US Inflation Rates; BOC & ECB Rate Decisions
FX Week Ahead - Top 5 Events: Chinese, Mexican, US Inflation Rates; BOC & ECB Rate Decisions

Find Your Forex Entry Point: 3 Entry Strategies To Try
Find Your Forex Entry Point: 3 Entry Strategies To Try
WikiFX Broker
Latest News
Brazilian Man Charged in $290 Million Crypto Ponzi Scheme Affecting 126,000 Investors
Become a Full-Time FX Trader in 6 Simple Steps
ATFX Enhances Trading Platform with BlackArrow Integration
Decade-Long FX Scheme Unravels: Victims Lose Over RM48 Mil
The Top 5 Hidden Dangers of AI in Forex and Crypto Trading
IG 2025 Most Comprehensive Review
Construction Datuk Director Loses RM26.6 Mil to UVKXE Crypto Scam
SEC Drops Coinbase Lawsuit, Signals Crypto Policy Shift
Should You Choose Rock-West or Avoid it?
Scam Couple behind NECCORPO Arrested by Thai Authorities
Currency Calculator


