简体中文
繁體中文
English
Pусский
日本語
ภาษาไทย
Tiếng Việt
Bahasa Indonesia
Español
हिन्दी
Filippiiniläinen
Français
Deutsch
Português
Türkçe
한국어
العربية
British Pound Technical Analysis: GBP/USD, GBP/JPY, EUR/GBP
Abstract:BRITISH POUND, GBP/USD, GBP/JPY, EUR/GBP, IGCS – TALKING POINTS: - Descending Channel break hints at further gains for GBP/USD. - Ascending Channel continuing to guide GBP/JPY higher. - EUR/GBP poised to extend losses after diving back below key support.
The British Pound is positioned to gain ground against its major counterparts in the near term, as a series of bullish technical patterns take shape across multiple GBP crosses. Here are the key levels to watch for GBP/USD, GBP/JPY and EUR/GBP in the weeks ahead.
GBP/USD DAILY CHART – DESCENDING CHANNEL BREAK HINTS AT GAINS

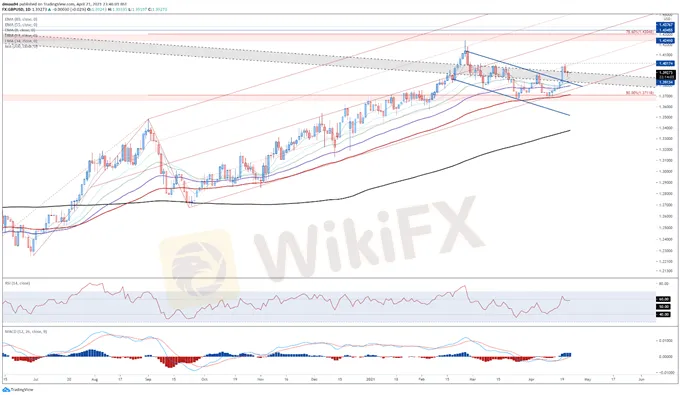
The British Pound looks set to extend recent gains against the US Dollar, as prices breaches Descending Triangle resistance and remains constructively positioned above psychological support at 1.3900.
Bullish moving average stacking, in tandem with the RSI and MACD tracking above their respective neutral midpoints, suggests that the path of least resistance is higher.
A retest of the monthly high (1.4009) looks likely in the near term, with a break above needed to carve a path for the exchange rate to challenge the yearly high (1.4241).
Alternatively, a daily close below 1.3900 could neutralize short-term buying pressure and precipitate a short-term pullback towards the 21-EMA (1.3841).
GBP/JPY DAILY CHART – ASCENDING CHANNEL NURTURING UPTREND

GBP also appears poised to climb higher against the Japanese Yen in the coming days, as prices continue to track within the confines of an Ascending Channel and hold above the psychologically imposing 150.00 handle.
Once again, with the RSI and MACD tracking firmly above their neutral midpoints, bullish momentum seems to be building and could drive price higher in the short term.
A daily close back above the 8-EMA (150.55) probably opens the door to a retest of the April 20 high (151.98), with a convincing push above bringing the yearly high (153.41) into the crosshairs.
However, if Ascending Channel support and the 34-EMA (150.18) gives way, a pullback to the 78.6% Fibonacci (148.51) could be on the cards.
EUR/GBP DAILY CHART – DESCENDING PITCHFORK GUIDING PRICE LOWER

The technical outlook for EUR/GBP rates continues to point to further downside, as prices break back below the trend-defining 55-EMA (0.8660) and Andrews Pitchfork median line.
Indeed, with RSI and MACD appearing to rollover in a bearish fashion, the primary downtrend extending from the September 2020 high may reassert itself in the coming weeks.
Slipping back below the 21-EMA (0.8624) likely triggers a push back towards the April 19 low (0.8589), with a convincing push below carving a path to challenge the yearly low (0.8472).
However, if prices can clamber back above the 55-EMA (0.8660), a retest of the monthly high (0.8719) could be on offer.
Disclaimer:
The views in this article only represent the author's personal views, and do not constitute investment advice on this platform. This platform does not guarantee the accuracy, completeness and timeliness of the information in the article, and will not be liable for any loss caused by the use of or reliance on the information in the article.
Read more

Weekly Fundamental Gold Price Forecast: Hawkish Central Banks a Hurdle
WEEKLY FUNDAMENTAL GOLD PRICE FORECAST: NEUTRAL

Gold Prices at Risk, Eyeing the Fed’s Key Inflation Gauge. Will XAU/USD Clear Support?
GOLD, XAU/USD, TREASURY YIELDS, CORE PCE, TECHNICAL ANALYSIS - TALKING POINTS:

British Pound (GBP) Price Outlook: EUR/GBP Downside Risk as ECB Meets
EUR/GBP PRICE, NEWS AND ANALYSIS:

Dollar Up, Yen Down as Investors Focus on Central Bank Policy Decisions
The dollar was up on Thursday morning in Asia, with the yen and euro on a downward trend ahead of central bank policy decisions in Japan and Europe.
WikiFX Broker
Latest News
FCA Warns Against 10 Unlicensed or Clone Firms
CySEC Warns Against 14 Unlicensed Investment Websites
Top Currency Pairs to Watch for Profit This Week - March 31, 2025
Will natural disasters have an impact on the forex market?
Philippines Deports 29 Indonesians Linked to Online Scam Syndicate in Manila
Exposing the Top 5 Scam Brokers of March 2025: A Closer Look by WikiFX
Gold Prices Climb Again – Have Investors Seized the Opportunity?
Webull Launches SMSF Investment Platform with Zero Fees
Australian Regulator Warns of Money Laundering and Fraud Risks in Crypto ATMs
The Withdrawal Trap: How Scam Brokers Lure Victims into Paying More
Currency Calculator


