简体中文
繁體中文
English
Pусский
日本語
ภาษาไทย
Tiếng Việt
Bahasa Indonesia
Español
हिन्दी
Filippiiniläinen
Français
Deutsch
Português
Türkçe
한국어
العربية
Gold Price Analysis
Abstract:Earlier this month, gold price saw a sharp decline below $1,750 against the US Dollar. The price even declined below $1,700 before the bulls appeared near $1,680.

Earlier this month, gold price saw a sharp decline below $1,750 against the US Dollar. The price even declined below $1,700 before the bulls appeared near $1,680.

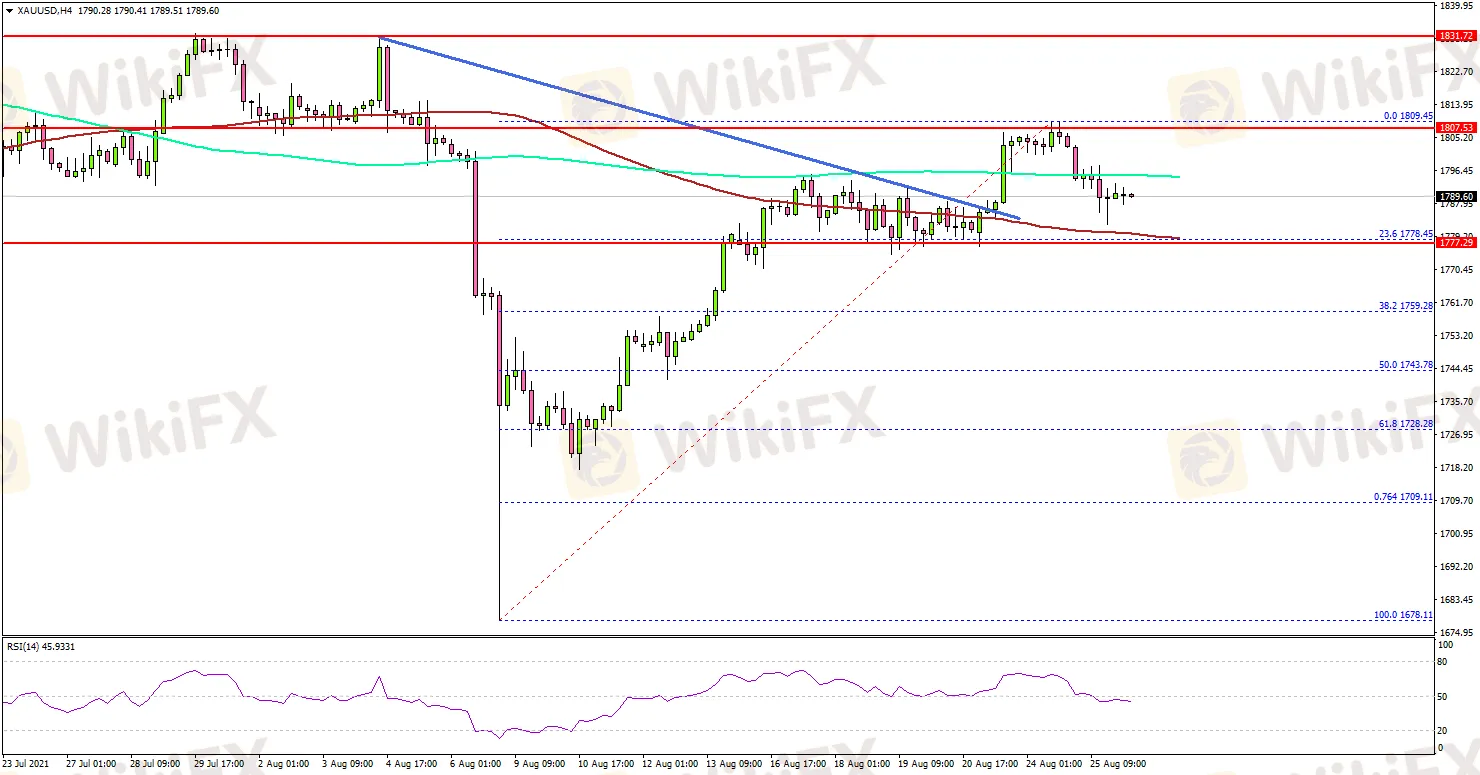
The 4-hours chart of XAU/USD indicates that the price traded as low as $1,678. Recently, there was a strong recovery wave above the $1,720 and $1,750 resistance levels.
There was a break above a key bearish trend line with resistance at $1,788. The pair surpassed the $1,800 level, the 100 simple moving average (red, 4-hours), and the 200 simple moving average (green, 4-hours).
However, there was no upside continuation above $1,810. A high is formed near $1,808 and the price is now correcting gains. On the downside, there is a major support forming near $1,778 and the 100 simple moving average (red, 4-hours).
The 23.6% Fib retracement level of the upward move from the $1,678 swing low to $1,808 high is also near $1,778. If there is a downside break below $1,778, the price could correct lower towards $1,750.
The next major support could be $1,743 or the 50% Fib retracement level of the upward move from the $1,678 swing low to $1,808 high. On the upside, the price is facing resistance near $1,808 and $1,810.
The main resistance sits near $1,830, above which the price could rise towards $1,850.
- END -

Disclaimer:
The views in this article only represent the author's personal views, and do not constitute investment advice on this platform. This platform does not guarantee the accuracy, completeness and timeliness of the information in the article, and will not be liable for any loss caused by the use of or reliance on the information in the article.
WikiFX Broker
Latest News
Cinkciarz.pl Under Fire: Frozen Accounts, Missing Funds
First Unfair Trading Case Reported Under South Korea’s Virtual Asset User Protection Act
“Predict and Win” Big Rewards! Join the Contest Now
Mitrade Ensures Trader Protection Backed by Lloyd's of London
Rs. 1 Billion Ponzi Scam: 3K Investors Duped by Engineers
Upbit Faces Severe Penalties for AML and KYC Violations
Yen's Weakness Raises Concerns
Why the Federal Reserve Is So Important
Boerse Stuttgart Digital Secures EU-Wide MiCAR Crypto License
South Africa's FSCA Warns against CMFX Trading
Currency Calculator


