简体中文
繁體中文
English
Pусский
日本語
ภาษาไทย
Tiếng Việt
Bahasa Indonesia
Español
हिन्दी
Filippiiniläinen
Français
Deutsch
Português
Türkçe
한국어
العربية
Bitcoin (BTC) Rockets Above $42,000 Resistance Level
Abstract: (BTC) has reclaimed a short-term resistance level and is currently in the process of creating a higher low on the daily chart.
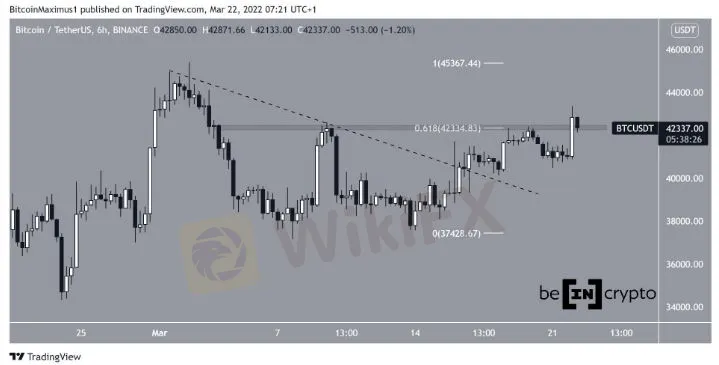
Bitcoin had been decreasing underneath a descending resistance line (dashed) since March 1. On March 15, it managed to break out from the line and continued to move up.
Initially, the price was rejected by the $42,330 resistance. This is the 0.618 Fib retracement resistance level when measuring the most recent drop and also a horizontal resistance area.
However, BTC was successful in moving above the area on March 22 and is currently attempting to validate it as support. If successful, this would be a bullish development because the 0.618 Fib retracement resistance level is often a crucial resistance to overcome after considerable drops.

Long-term support level
The daily chart shows that BTC has been following a longer-term ascending support line since Jan 22. It bounced at the line on March 14 (green icon) to initiate the current upward move.
More importantly, technical indicators are gradually turning bullish as both the MACD and RSI are increasing.
In addition to this, the MACD is nearly positive. This is a sign that is usually associated with bullish trends. Furthermore, the RSI has already moved above 50, another sign of bullish trends.
If BTC manages to break out from the longer-term descending resistance line (dashed), it would likely accelerate very quickly.

BTC wave count analysis
Currently, there are three potential wave counts at play and all suggest that BTC is trading inside a symmetrical triangle.
The most likely count suggests that BTC is in a B wave triangle. After the triangle is complete, a breakout and move towards $50,000 would be expected.
The sub-wave count is shown in white.

The second possibility suggests that BTC has just completed a long-term correction that began in November 2021 and an increase towards a new all-time high would be expected.
While the ratios are suitable, the shape of the triangle is unusual, casting some doubt on this possibility.

The third scenario suggests that BTC is in a fourth wave triangle. Following the completion of this pattern, a breakdown and drop below $30,000 would be expected.
Due to the discrepancy between waves two and four, this seems to be the least likely count.

Disclaimer:
The views in this article only represent the author's personal views, and do not constitute investment advice on this platform. This platform does not guarantee the accuracy, completeness and timeliness of the information in the article, and will not be liable for any loss caused by the use of or reliance on the information in the article.
Read more

The Ultimate Guide to Automated Forex Trading in 2025
Modern markets are revolutionized by automated trading systems, which now execute 70-85% of all transactions. These advanced automated trading software solutions, commonly called trading robots or Expert Advisors (EAs), leverage algorithmic precision for automatic trading across forex, stocks, and commodities 24/7. By removing emotional interference and executing trades in microseconds, auto forex trading platforms create fair opportunities for all market participants. For those new to automated trading for beginners, these systems provide disciplined, backtested strategies while significantly reducing manual effort.

How Reliable Are AI Forex Trading Signals From Regulated Brokers?
Discover how reliable AI Forex trading signals are and why using a regulated broker boosts their effectiveness. Learn key factors to evaluate accuracy and enhance your trading.

Top Currency Pairs to Watch for Profit This Week - March 31, 2025
Discover the top 5 currency pairs to trade for profit this week, March 31, 2025—USD/JPY, EUR/USD, GBP/USD, AUD/USD, USD/CHF—with simple strategies and best times.

AI-Powered Strategies to Improve Profits in Forex Trading
Boost Forex profits with AI: predictive analytics, real-time automation, and smart risk management strategies for sharper trades and fewer losses.
WikiFX Broker
Latest News
How Crypto Trading Transforms FX and CFD Brokerage Industry
FCA Warns Against 10 Unlicensed or Clone Firms
CySEC Warns Against 14 Unlicensed Investment Websites
Top Currency Pairs to Watch for Profit This Week - March 31, 2025
Will natural disasters have an impact on the forex market?
Philippines Deports 29 Indonesians Linked to Online Scam Syndicate in Manila
Exposed: Deceptive World of Fake Trading Gurus – Don’t Get Fooled!
AI-Powered Strategies to Improve Profits in Forex Trading
Stock Market Trading Volume Drops by 97.58 Billion Naira This Month
Why does your mood hinder you from getting the maximum return from an investment?
Currency Calculator


