简体中文
繁體中文
English
Pусский
日本語
ภาษาไทย
Tiếng Việt
Bahasa Indonesia
Español
हिन्दी
Filippiiniläinen
Français
Deutsch
Português
Türkçe
한국어
العربية
What are Commodity Currency Pairs?
Abstract:Countries with substantial natural resources that account for revenue and tax receipts have an implicit backing for their legal tender.

The currencies of countries around the world are fiat instruments, meaning that they have no backing by anything other than the full faith and credit of the nations that issue the legal tender.In the past, many currencies used gold and silver to provide support for the foreign exchange instruments, but the metals prevented countries from making significant changes in the money supply to address sudden changes in economic conditions.
Meanwhile, some countries with substantial natural resources that account for revenue and tax receipts have an implicit backing for their legal tender. The ability to extract commodities from the crust of the earth within a nations borders or grow crops that feed the world allows for exports and revenue flows. While those countries have fiat currencies in the international financial system, the implied backstop of commodity production makes them commodity currencies.
Commodities provide support for some foreign exchange instruments
The fundamental equation in the world of commodities often dictates the path of least resistance for prices. While demand is ubiquitous as all people around the globe are consumers of raw materials, production tends to be a local affair.
Commodity output depends on geology when it comes to energy, metals, and minerals. Soil, access to water, and climate make some areas of the world best-suited for growing agricultural products. Chile is the worlds leading producer of copper. The vast majority of cocoa beans, the primary ingredient in chocolate, come from the Ivory Coast and Ghana, two countries in West Africa.
In Chile and the African nations, the production of the raw materials accounts for a significant amount of revenues and employs many people, making them a critical factor when it comes to economic growth. Meanwhile, the Australian and Canadian currencies are highly sensitive to commodity prices as both nations are significant producers and exporters of the raw materials to consumers around the globe.
Australia and Canada have commodity currencies
Australia and Canada produce a wide range of agricultural and energy products, as well as metals and minerals. Australia‘s geographical proximity to China, the world’s most populous nation with the second-leading economy, makes it a supermarket for the Asian country. Canada borders on the US, the wealthiest consuming nation on the earth. Therefore, Australia and Canada are both commodity supermarkets for a substantial addressable market of consumers.
In 2011, commodity prices reached highs, and the price action in the Australian and Canadian currencies versus the US dollar shows their sensitivity to raw material prices.

The quarterly chart of the Australian versus the US dollar currency pair highlights that highs in commodity prices in 2011 took the foreign exchange relationship to its all-time high of $1.1005. The price spike to the downside during the first quarter of 2020 that took the A$ to $0.5510 came on the back of a deflationary spiral caused by the global Coronavirus pandemic that sent many raw material prices to multiyear lows.
Canada is a significant oil-producing nation. In 2008, the price of nearby oil futures rose to an all-time peak of over $147 per barrel.

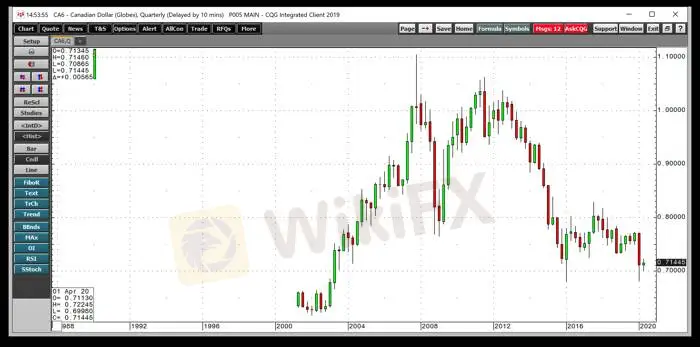
The quarterly chart of the Canadian versus the US dollar currency pair shows that the record high came in late 2007 at $1.1043 as the price of oil was on its way to the record peak. The highs in raw material prices in 2011 took the C$ to a lower high of $1.0618. The deflationary spiral in March 2020 pushed the C$ to a low of $0.6820 against the US dollar.
Both the Australian and Canadian dollars are commodity currencies that move higher and lower with raw material prices over time.
Brazils real also tracks the prices of some commodities
Brazil is an emerging market, but the most populous nation in South America with the leading GDP in the region is a significant producer of commodities. The price relationship between the Brazilian real and the US dollar is another example of how the multiyear highs in commodity prices in 2011 sent the value of a commodity-sensitive currency to a high.

The quarterly chart of the Brazilian real versus the US dollar currency pair shows that the real reached a record high of $0.65095 against the US dollar in 2011 when commodity prices reached a peak.
While the Australian and Canadian dollar and Brazilian real are fiat currencies, they each reflect the price action in the raw material markets, making them commodity currencies. The foreign exchange instruments may not have express backing of the nations raw material production; there is an implied backing as higher commodity prices lift the local economies and government tax revenues. Commodity currencies can serve as proxies for the asset class as they move higher and lower with raw material prices.

Disclaimer:
The views in this article only represent the author's personal views, and do not constitute investment advice on this platform. This platform does not guarantee the accuracy, completeness and timeliness of the information in the article, and will not be liable for any loss caused by the use of or reliance on the information in the article.
Read more

Ringgit Remains Flat Amid Holidays, US Debt Concerns Loom
The Malaysian ringgit began the week steady against the US dollar, showing little movement due to a lack of market catalysts during the holiday-shortened trading week.

Japan to Take Action to Stabilize the Yen
Japan faces yen depreciation due to interest rate gaps; officials plan measures to stabilize forex market volatility.

The WikiFX 2024 Annual User Report is here! Come and claim your exclusive identity!
Looking back at the past year, Whether it’s checking the credibility of brokers or browsing the latest forex news, WikiFX has become your indispensable and reliable assistant.

Will Inflation Slow Down in the New Year 2025?
Will inflation slow down in 2025? Experts weigh in on projections, economic policies, and potential impacts, offering insights into what the new year may hold.
WikiFX Broker
Latest News
Trading is an Endless Journey
Japan to Take Action to Stabilize the Yen
Ringgit Remains Flat Amid Holidays, US Debt Concerns Loom
Taurex: Is it Safe to Invest?
Malaysia’s Securities Commission Enforces Ban on Bybit & Its CEO
New Zealand's FMA Warns Against "YouTube Crypto Investment Scam"
Will Inflation Slow Down in the New Year 2025?
The WikiFX 2024 Annual User Report is here! Come and claim your exclusive identity!
SCAM ON SCAM: New Tactic Used by Scammers
Crypto Fraud: MBBS Student Linked to Rs.8 Lakh Scam
Currency Calculator


