简体中文
繁體中文
English
Pусский
日本語
ภาษาไทย
Tiếng Việt
Bahasa Indonesia
Español
हिन्दी
Filippiiniläinen
Français
Deutsch
Português
Türkçe
한국어
العربية
How to Use Volume to Improve Your forex Trading?
Abstract:Technical analysis is an important part when you are trading forex, as well as one of the skills that traders should master. The core element of forex technical analysis includes volume analysis.

Volume can change price trends. For example, breakout of key positions in both uptrend and downtrend are accompanied by a great deal of trading volume. The trading volume can be reflected in the forex market as a dense trading area, and the change of the future market can be predicted by the increase or decrease of the trading volume of both long and short sides at this time.
Technical analysis without volume analysis is like shooting an arrow with closed eyes. Of course, it is difficult to hit the target. So in this article, we are going to introduce key points related to volume analysis, and why volume analysis in forex trading is really useful.
What's Volume in Forex Trading?
Volume in the forex market and volume you see in the stock market are two completely different definitions. The trading volume in the stock market refers to the number of lots traded and sold by all investors in the market. It is a quantitative sample, while in FX trading, the volume it's the number of lots traded in a currency pair or in the entire market within a specified time period (also known as the Turnover). As a measure of trading activity, it is simply the amount of currency that changes hands from sellers to buyers.
Being the spot FX a decentralised market, partial volume figures are taken as a proxy for the overall numbers: either from a particular market maker or derived from liquidity aggregators.
Notice that volume is not synonymous of speed nor volatility, as price can rapidly rise or fall in a thin market as well.
In trading the financial markets, volume represents how much of a financial asset has exchanged hands over a particular time period. By correlating volume levels with price data, traders can evaluate the overall market sentiment. This volume data could add a useful edge to their trading strategies.
However, forex trading occurs in a decentralised market. In the absence of a primary exchange through which all transactions are conducted, there is no way to determine the exact amount of currency being traded at any point of time. So, volume data can vary across different broker platforms. This is why traders often overlook this data in the FX market. But, with the right tools at your disposal, it is possible to make use of volume data to fine tune trading strategies.
What's the Tick Volume?
A tick represents a single change in the currency price quote, up or down. One tick is one trade, which means that a significant spike in the tick volume indicates that numerous traders have opened or closed their trades during a particular period of time.
When trading volume is higher, it could be easier to buy and sell currency pairs at chosen prices, since a large number of traders are present on the opposite side of your trade. This is also known as market liquidity. Increased buying volumes, with a price hike, signals that buyers are in control. Similarly, sellers are in control when prices are declining.
Although there is a difference between tick volumes and actual traded volumes in spot forex, studies have shown the existence of a high positive correlation between the two. Correlations of more than 90% have been found between price updates and real volume. Therefore, it can be concluded that tick volume data is an important piece of information. However, there is one thing we would like to make clear: tick-based volumes and volumes coming from future exchanges are not considered “true” volumes.
How to Measure Volume by Counting the Tick Movements?
The Forex market is a decentralized market, which means that there is no formula for volume or method of keeping track of the number of contracts and contract sizes, such as in the stock market. The Forex market measures volume by counting the tick movements. The logic behind this is straightforward:
a) Price moves up and down in ticks.
b) The Forex market cannot measure how many contracts are sold, but it can measure how many ticks price moves up or down in any given time frame.
c) It can still be measured by measuring how many ticks price moves up and down.
d) Therefore, irrespective of how many transactions have been completed to make the price move, the net effect will be measured.
It is the equivalent of focusing on the next result instead of analyzing the process. The volume measurement in the Forex market is looking at how much price moves within a certain period and it does not care how many or few buying and selling transactions are in fact needed to make that price move 1 tick. All it knows is how many ticks it moved, regardless of the fact if 100 trades were involved or 10,000.
How To Use Volume To Improve Your Trading?
Price fluctuations are the result of coordinated buying or selling at a specific moment. There is a saying that if there are more buying than selling in the market, the market will rise; if there are more selling than buying, the market will fall.
This statement is correct, but the prerequisite is: to a large extent depends on the amount of buying or selling. For example, there may be a situation where there are 100 buyers and each buyer buys half a lot, while there is only one seller who sells 100 lots. As a result, the market price will fall, instead of rising, because the actual volume of a seller is greater than the sum of the volume of the remaining 100 buyers.
This brings us to the volume indicator in the forex market, which deserves our special attention. As you can see in the table below, MetaTrader 4 (and indeed any other trading platform) has a list of indicators in which volume is independent of trend and volatility indicators. This means that this is a special set of indicators that require special attention.
The MetaTrader 4 platform provides at least four of such indicators(as you can see in the table) by default, each of which is very important and has its own function. However, volume indicators are a good summary of what we need to know about such indicators.
The application of this indicator is as simple as any other trend indicators or oscillators, as long as the indicator is added below the actual price chart in the lower part of the screen.

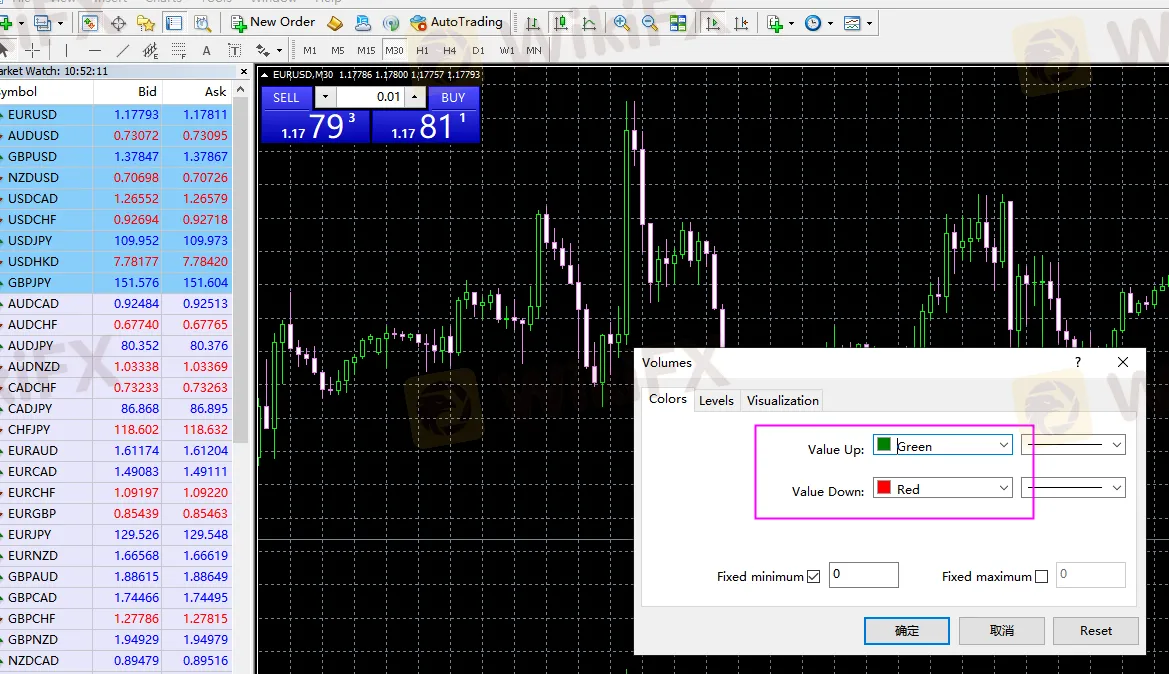
As shown in the table below, without any additional Settings, you just click OK. You can change the color to any other color you want, but since green and red are associated with up and down movements by default, green and red are recommended.

The volume indicator shows the volume represented by each candle in a given chart. This means that in a monthly chart, a candle shows the volume of the month, weekly candles show weekly turnover, and so on.
The larger the volume, the larger the candle, and vice versa: the smaller the volume, the smaller the candle. Large green candles indicate buyers' power is stronger than sellers' power, so the market is bullish. On the other hand, a high green candle indicates that sellers' power is stronger than the buyers' power, and the market is bearish.

In other words, if the green volume candle is high, go long; Red turnover candle is big, go short.
How to Understand Tick Volume in Technical Analysis?
There are several technical indicators for tick volume. “Volume Indicators” on MetaTrader 4 can provide traders insights into whether a price movement is worth taking a look at.
1. On Balance Volume (OBV)
OBV appears in the form of a line on the charts. If the closing price level of the current candlestick is higher than the one preceding it, the current volume is added to the previous volume and the line ascends. Similarly, when the closing price of the current candlestick is lower than the preceding one, the volume gets subtracted from the previous volume, and the line goes down. This indicator precedes price movements and can, therefore, provide signals to place a trade.
2. Accumulation/Distribution
When volumes rise, the associated price changes during that timeframe play a greater role in determining the value of this indicator. This is yet another valuable price-volume indicator.
3. Money Flow Index (MFI)
The rate at which money flows into a currency pair or withdraws from it can be measured by MFI. Traders often find it similar to the Relative Strength Index (RSI), except that it takes volume into account.
4. Volumes
Volume bars are the easiest to interpret and used widely. They show the number of price changes (ticks). Volume bars turn green when they are bigger than the previous one, or else they turn red.
Combining Volumes with Other Indicators
You are likely to find that you can enhance the effectiveness of the forex volume indicator if you use it in conjunction with another indicator.
For example, you might use the Keltner channel indicator to suggest possible breakout levels, and may then validate these using the volume as a guide. Keltner channels are a type of volatility envelope, widening as prices become more choppy, and narrowing in quiet trading times.
If the price breaks out of the envelope, it may indicate the start of a new trend.
A common drawback of such trend-following methods is that they frequently generate false signals, and only infrequently signify a true trend. Using the volumes indicator, we may be able to filter out some of those false signals.

Disclaimer:
The views in this article only represent the author's personal views, and do not constitute investment advice on this platform. This platform does not guarantee the accuracy, completeness and timeliness of the information in the article, and will not be liable for any loss caused by the use of or reliance on the information in the article.
Read more

IG 2025 Most Comprehensive Review
This article evaluates the broker from multiple dimensions, including a basic introduction, fees, safety, account opening, and trading platforms.

EXNESS 2025 Most Comprehensive Review
This article evaluates the broker from multiple dimensions, including a basic introduction, fees, safety, account opening, and trading platforms.

Top Profitable Forex Trading Strategies for New Traders
Know profitable Forex strategies for beginners, including risk management tips, best currency pairs, technical analysis tools, and timeframe selection.

WikiFX Review: Is IVY Markets Reliable?
IVY Markets, established in 2018, positions itself as a global brokerage offering a diverse range of trading instruments, including Forex, Commodities, Cryptocurrencies, and Stocks. The platform provides two primary account types—Standard and PRO—with a minimum deposit requirement of $50 and leverage up to 1:400.
WikiFX Broker
Latest News
Germany's Election: Immigration, Economy & Political Tensions Take Centre Stage
WikiFX Review: Is IVY Markets Reliable?
IG 2025 Most Comprehensive Review
ED Exposed US Warned Crypto Scam ”Bit Connect”
Top Profitable Forex Trading Strategies for New Traders
EXNESS 2025 Most Comprehensive Review
Currency Calculator


