Abstract:A Break in Structure (BOS) is a significant change in an established price trend or pattern in the financial markets that signals a possible change in market sentiment and provides trading opportunities for those who are able to recognize and act on it. Traders and investors use BOS as signals by identifying key turning points in market dynamics.
A Break in Structure (BOS) is a significant change in an established price trend or pattern in the financial markets that signals a possible change in market sentiment and provides trading opportunities for those who are able to recognize and act on it. Traders and investors use BOS as signals by identifying key turning points in market dynamics.
What is BOS in trading?
In trading, a Break of Structure (BOS) is a key concept in technical analysis that helps identify significant changes in the direction or pattern of an asset's price movement. This typically happens when a support or resistance level is breached decisively, indicating a shift in market sentiment. A break of structure can mark the conclusion of an existing trend or the beginning of a new one, and it frequently serves as a crucial entry or exit point for traders.
For example, if a stock has been consistently reaching higher highs and higher lows but then breaks below a previously established higher low, it may indicate a potential reversal from an uptrend to a downtrend. Traders utilize BOS to make strategic decisions, such as entering short positions following a bearish break of structure or exiting long positions when a bullish trend begins to lose its upward momentum.
Identifying and understanding breaks of structure is an essential skill for traders, as it helps them manage risk and take advantage of shifting market dynamics.
A Break of Structure (BOS) usually presents a good opportunity for traders to enter positions during a trend reversal with manageable risk. Traders often set stop-loss orders at levels that would negate the validity of the BOS.
Main types of market structure
In technical analysis, there are three classical market structures bullish structure, bearish structure, and ranging structure. These structures assist traders and investors in assessing the current market condition and making decisions regarding their positions.
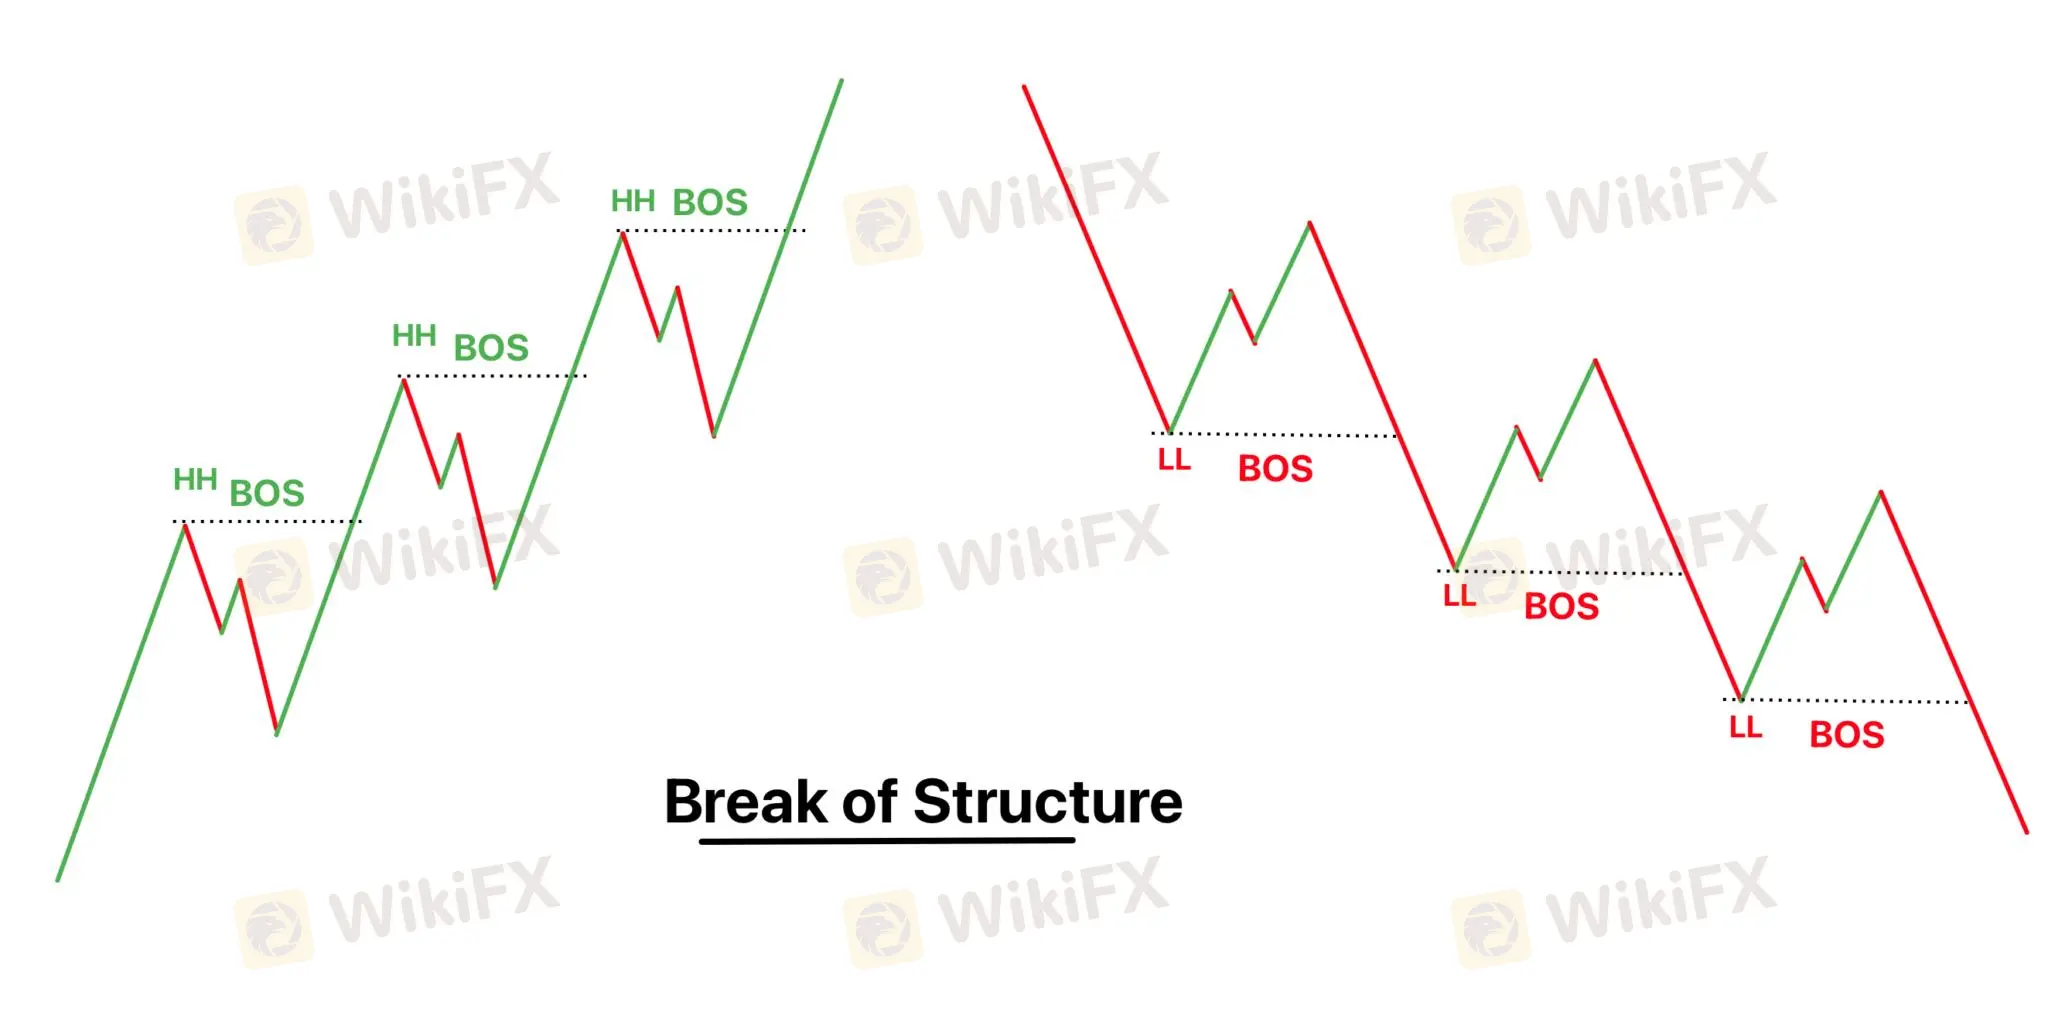
Bullish Market Structure
In a bullish market structure, prices generally exhibit higher highs and higher lows. This indicates a prevailing uptrend characterized by rising optimism among traders and investors. A Break of Structure (BOS) in a bullish context occurs when the price makes a lower low, signaling a potential trend reversal. Traders often place stop-loss orders below the recent higher low, as a drop below this level could invalidate the bullish trend.

Bearish Market Structure
Conversely, a bearish market structure is defined by lower highs and lower lows, signifying a predominant downtrend. In this scenario, a BOS manifests when the price forms a higher high, hinting at a potential trend reversal. Traders typically position their stop-loss orders above the recent lower high, as a breach of this level could negate the bearish trend.

Sideways (Ranging) Market Structure
In a sideways or ranging market structure, prices move within a horizontal range without forming clear higher highs or lower lows. BOS identification in this context can be challenging. Traders often look for a decisive breakout above or below the range boundaries to spot potential trend shifts. Stop-loss placement in a ranging market often involves setting orders just outside the range to mitigate losses in case of a false breakout.
 Market Structure")
How to Identify a Structural Break
According to the Structural Breakout Theory, identifying a BOS begins with discerning the current trend by analyzing existing peaks and troughs. This includes looking for successive higher highs and higher lows in an uptrend, or lower highs and lower lows in a downtrend.
It is vital to recognize that structures can change over different timeframes; what appears to be a bullish pattern in one timeframe may simply be a corrective phase in a broader bearish move in another timeframe.
In order to accurately identify BOS, traders need to focus on key swing points: strong swing points (which should not be breached while the trend remains valid) and weak swing points (which are expected to be exceeded if the trend continues).
A true BOS is confirmed when the price not only breaks through the weak swing point but also closes convincingly above it, signaling a new high or low in the trend. While a wick beyond this point may indicate the presence of a BOS, it is considered less reliable and may be nothing more than an attempt at a liquidity grab.
How to trade BOS in trading?
Trading the Break of Structure (BoS) effectively requires combining it with other strategies for better accuracy in forecasting future price direction. Heres a simplified explanation of how you can use BoS in conjunction with a moving average and candlestick patterns strategy:

1.Setting Up:
- First, identify the lower lows and lower highs in an downtrend.
- Add an 21-period Exponential Moving Average (EMA) to your chart.
2.Identifying the BoS:
- A Break of Structure occurs when the price moves below these lower lows. This indicates potential for the price to continue moving down.
3.Executing a Sell Trade:
- After a bearish Break of Structure, wait for a bearish candlestick pattern to form, like a Bearish Engulfing pattern or a Pin Bar. This is your signal to enter a sell trade.
4.Closing the Trade:
- Monitor the price in relation to the EMA. Close your trades when the price breaks through the EMA, signaling a potential change in trend or loss of momentum.
Remember, this strategy is a basic example to help you understand how to integrate BoS into your trading. Its important to develop and test your own strategies, considering your trading style and risk tolerance. Using BoS as part of a broader strategy can enhance the effectiveness of your trades by providing additional confirmation of market trends.
Case Study: Trading with Bull BoS and Demand Zone
In this trade, I observed a clear Bull BoS in the market. This was identified when the price broke above a previous significant high, indicating a strong upward momentum.
Identification of Bull BoS:
The market was trending upwards, making higher highs and higher lows.
A Bull BoS was confirmed when the price surpassed a recent high point, signaling a potential continuation of the uptrend.

Formation of Demand Zone:
After the Bull BoS formation, the price retraced back to the region of the breakout, forming what is known as a demand zone.
This demand zone was located right around the area where the BoS occurred, making it a significant level for potential order accumulation.

Trade Execution:
Observing the price action, I waited for the price to revisit this demand zone.
As anticipated, the price entered the demand zone and started to show signs of order accumulation. This was my cue to prepare for a buy trade.

Trade Outcome:
Soon after filling orders in the demand zone, the price began to move upwards.
This movement confirmed my analysis, and I entered a buy trade, capitalizing on the strong upward momentum.
The trade offered a high risk-reward ratio, as the entry point at the demand zone provided a clear stop-loss level below the zone, and the upward potential was significant due to the confirmed uptrend.

What are the suitable brokers for active traders?
For active traders, brokers offering competitive commissions and high liquidity are suitable. Below is information about them:


