简体中文
繁體中文
English
Pусский
日本語
ภาษาไทย
Tiếng Việt
Bahasa Indonesia
Español
हिन्दी
Filippiiniläinen
Français
Deutsch
Português
Türkçe
한국어
العربية
US Dollar Price Targets: USD Threatens Breakout of Uptrend Resistance
概要:The US Dollar is probing fresh yearly highs into the to open of September trade, but is the rally sustainable? Here are the levels that matter on the DXY weekly chart.
US Dollar breakout testing uptrend resistance into the start of September
The US Dollar is probing fresh yearly highs at levels not seen since May of 2017 with the advance now testing uptrend resistance. While the broader outlook remains constructive, the immediate rally may be vulnerable at these levels in to the open of September trade. Here These are the updated targets and invalidation levels that matter on the DXY weekly price chart. Review my latestWeekly Strategy Webinar for an in-depth breakdown of this Dollar price setup and more.
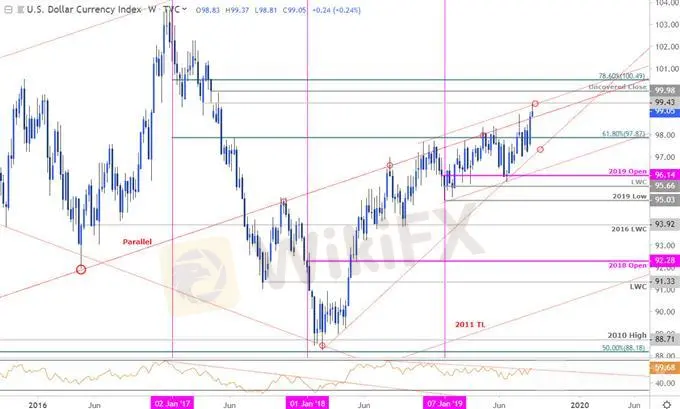
US Dollar Index Price Chart - DXY Weekly

Chart Prepared by Michael Boutros, Technical Strategist; DXY on Tradingview
Notes: In last month‘s US Dollar Index Weekly Price Outlook we noted that DXY was, “approaching long-term uptrend resistance,” at a slope we’ve been tracking for years now. The trendline in focus is the parallel of the 2011 slope, extended off the 2012 highs – this gradient has been pivotal in USD price action, calling the 2016 lows & the October 2017 highs and governing the 2018 Dollar advance into this year. Another parallel extending off the 2018 highs suggests the greenback may still be at risk here with a close above 99.43 needed to validate a breach of up-trend resistance.
Subsequent topside objectives are eye at the 2017 un-covered close at 99.98 backed by the 78.6% retracement of the 2017 decline at 100.49. Monthly open support at 98.83 backed by 97.87. Ultimately at break below the 2018 support line (currently ~97.30s) would be needed to suggest a more significant high is in place for the Dollar.
Bottom line: The US Dollar Index is testing long-term up-trend resistance again here – heading into the start of September trade, look for a reaction at this slope with a breach / close above needed to keep the broader long-bias viable. From at trading standpoint a good place to reduce long-exposure / raise protect stops – be on the lookout for possible topside exhaustion this week while below the 2018 parallel. Ultimately a larger pullback would offer more favorable entries at trend support targeting a stretch into the 100-handle. A breach would likely see accelerated gains for the Dollar – stay nimble into the open.
Even the most seasoned traders need a reminder every now and then-Avoid these Mistakes in your trading
---
Previous Weekly Technical Charts
Sterling (GBP/USD)
Gold (XAU/USD)
Silver (XAG/USD)
Crude Oil (WTI)
Canadian Dollar (USD/CAD)
免責事項:
このコンテンツの見解は筆者個人的な見解を示すものに過ぎず、当社の投資アドバイスではありません。当サイトは、記事情報の正確性、完全性、適時性を保証するものではなく、情報の使用または関連コンテンツにより生じた、いかなる損失に対しても責任は負いません。
WikiFXブローカー
レート計算


