简体中文
繁體中文
English
Pусский
日本語
ภาษาไทย
Tiếng Việt
Bahasa Indonesia
Español
हिन्दी
Filippiiniläinen
Français
Deutsch
Português
Türkçe
한국어
العربية
Dow Jones & S&P 500 Price Outlook After June Fed Meeting
Abstract:Following Junes FOMC rate decision, the Dow Jones and the S&P 500 may enjoy a renewed sense of euphoria as monetary policy is set to loosen.
Dow Jones & S&P 500 Price Outlook:
The Dow Jones closed Wednesday trading marginally higher after regaining ground lost early in the session
Similarly, the S&P 500 closed higher and was bolstered by the utilities sector which enjoyed a boost from lower inflation expectations
The indices will now look to the Trump-Xi meeting in Japan late next week
Dow Jones & S&P 500 Price Outlook After June Fed Meeting
After the Federal Reserve opened the door to rate cuts in the near future, the outlook for both the Dow Jones and the S&P 500 has perked up. With the possibility of looser monetary policy – thereby allowing corporations to borrow more money in an effort to spur growth – the fundamental groundwork has been laid for stocks to retake all-time highs. Now the concern lies with trade wars and the degree to which rate cuts have already been priced into the indices.
In the month-to-date, the Dow Jones has climbed 7% and the S&P 500 6.65%. It could be argued much of the returns can be attributed to the market‘s expectation of a dovish Federal Reserve. Those expectations were fulfilled Wednesday and the subsequent odds of a rate cut at July’s FOMC meeting have soared to 100%.
With that in mind, commentary from Fed officials and the pace at which the Fed will look to cut rates will likely dictate the follow-through of the two major stock indexes. If it comes to light that the market has priced in too much dovishness too soon, the rug could be pulled out from under the Indices. In the meantime, the Dow Jones and S&P 500 will look to nearby technical levels for price influence.
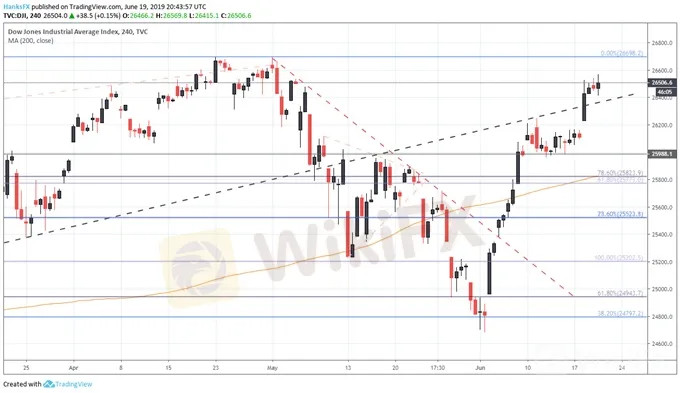
Dow Jones Price Chart: 4 - Hour Time Frame (February – June) (Chart 1)

To that end, the Dow Jones will have to negotiate topside resistance at May highs – around 26,698. The level will pose the first point of contention for a continued run higher, before subsequent resistance from highs in September 2018 come into play. On the other hand, the Industrial Average enjoys nearby support from the ascending trendline originating from February and secondary support around 26,000. For technical updates on the Dow Jones and S&P 500, follow @PeterHanksFX on Twitter.
S&P 500 Price Chart: 4 - Hour Time Frame (February – June) (Chart 2)

Not to be outdone, the S&P 500 posted a solid +0.30% return on the day – with considerable assistance from the utilities sector. The utility-tracking XLU ETF gained 1.15% in Wednesday‘s session alone, as deteriorating inflation expectations bolstered the industry’s profitability outlook. From a price perspective, the S&P 500 is much nearer to all-time highs – having posted a record closing price as recently as May 1. Regardless, the record level will similarly pose as resistance – but the Index has less distance to travel before a retest can be staged.
As far as support is concerned, the S&P 500 enjoys nearby buoyancy from the 23.6% Fib level around 2,900 and a potential trendline marked by May 1 and June 11 highs. That said, the latter level has not yet proven it holds technical influence and could therefore be dispatched easily. With the weeks most important event risk in the rearview, the two indices will shift their attention to commentary from the Bank of Japan – due to decide on their own interest rate early Thursday. Aside from scheduled event risk, trade war progress will remain crucial in maintaining the optimistic attitude that equity markets currently enjoy.
Disclaimer:
The views in this article only represent the author's personal views, and do not constitute investment advice on this platform. This platform does not guarantee the accuracy, completeness and timeliness of the information in the article, and will not be liable for any loss caused by the use of or reliance on the information in the article.
Read more

【MACRO Alert】The possibility of Trump winning the election is closely linked to market conditions! Could Japan become a big winner from this?
Although the market has responded positively to the prospect of Trump's possible re-election, and the Japanese stock market has shown an upward trend as a result, investors should also remain cautious and pay attention to the long-term impact of the election results on global economic policies and market sentiment. As strategist Tomo Kinoshita pointed out, while short-term market dynamics may be closely related to the election results, ultimately, the fundamentals of companies, economic data, an

Market Focus on Earnings Report
As we head into the second quarter earnings report season, the U.S. equity market is poised to capture significant attention. Recent geopolitical events, particularly the unconfirmed reports of an explosion in Iran's third-largest city last Friday, have injected volatility into commodities prices and bolstered the appeal of safe-haven assets like the U.S. dollar and Japanese Yen.

Daily Market Newsletter - February 8, 2024
Recap of Global Market Trends and Trading Opportunities

EURUSD Price May Retest $1.1206 Level Before Bullish Reversal Commence
EURUSD is pulling back
WikiFX Broker
Latest News
Beware: Online Share Buying Scam Costs 2,791,780 PHP in Losses
5 things I wish someone could have told me before I chose a forex broker
Unmasking a RM24 Million Forex Scam in Malaysia
U.S., Germany, and Finland Shut Down Garantex Over Money Laundering Allegations
Gold Prices Fluctuate: What Really Determines Their Value?
Dollar Under Fire—Is More Decline Ahead?
What Impact on Investors as Oil Prices Decline?
Forex Trading: Scam or Real Opportunity?
The Hidden Tactics Brokers Use to Block Your Withdrawals
Is the North Korea's Lazarus Group the Biggest Crypto Hackers or Scapegoats?
Currency Calculator


