简体中文
繁體中文
English
Pусский
日本語
ภาษาไทย
Tiếng Việt
Bahasa Indonesia
Español
हिन्दी
Filippiiniläinen
Français
Deutsch
Português
Türkçe
한국어
العربية
Bitcoin (BTC) Price May Rally, Market in Heavily Oversold Territory
Abstract:Bitcoin's recent rally and subsequent sharp sell-off has left the cryptocurrency looking heavily oversold, according to one technical indicator.
Bitcoin (BTC) Price Outlook, Chart and Analysis:
比特币(BTC)价格展望,图表和分析:
CCI indicator highlights oversold nature of the market.
CCI指标强调了市场的超卖性质。
Retail remain heavily long of Bitcoin – are they right?
零售仍然存在很长的比特币 - 他们是对的吗?
IG Client Sentiment Datashows how retail are positioned in a variety of cryptocurrencies. See how daily and weekly positioning can affect our trading bias. Bitcoin (BTC) trade data shows 78.7% of traders are net-long, a strong contrarian bearish signal. However, recent daily and weekly changes in sentiment give us a stronger bearish contrarian trading bias.
IG Client Sentiment数据显示零售在各种加密货币中的定位方式。了解每日和每周定位如何影响我们的交易偏差。比特币(BTC)的贸易数据显示,78.7%的交易者是净多头,这是强烈的逆势看跌信号。然而,最近的每日和每周情绪变化给我们带来了更强的看跌逆势交易偏见。
A Guide to Day Trading Bitcoin and Other Cryptocurrencies.
日间交易比特币及其他指南Cryptocurrencies。
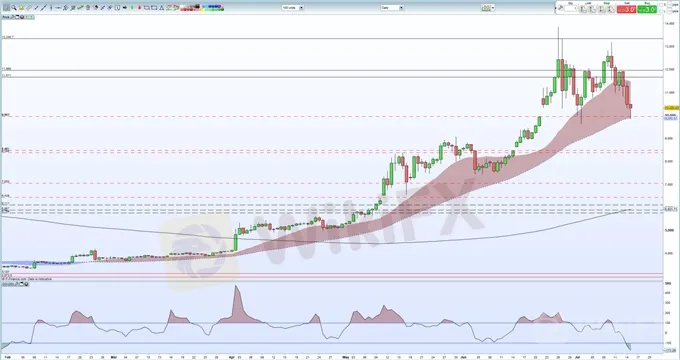
Bitcoins recent heavy sell-off has left the cryptocurrency in heavily oversold territory, according to the CCI indicator (bottom of the chart), leaving the market open to a short-term upside rebound. The July 2 spike-low at $9,640 remains in place for now, and if this remains the case a move back to $10,800 before $11,470 and the recent double-top around $11,900 cannot be discounted. The 50-day moving average, just under $10,000, also remains supportive if it survives a re-test. A decisive break lower could see a re-test of a cluster of trades between $8,600 and $9,600.
根据CCI指标(图表底部),比特币最近的大幅抛售使得加密货币处于严重超卖区域,使市场向空头开放 - 期限反弹。 7月2日的飙升至9,640美元的低点现在仍然存在,如果仍然如此,那么在11,470美元之前回到10,800美元,最近的双顶价在11,900美元左右不能打折。如果它能够在重新测试中幸存下来,那么50天移动平均线(仅低于10,000美元)仍然是支持性的。决定性下跌可能会重新测试一系列交易,价格在8,600美元至9,600美元之间。
Bitcoin (BTC) Daily Price Chart (February 2018 – July 15, 2019)
比特币(BTC)每日价格走势图(2018年2月 - 2019年7月15日)

Bitcoins Market Dominance Increases as Alt-Coins Fall Sharply
随着Alt-Coins大幅下跌,比特币的市场支配率增加
{9}
Bitcoins market dominance continues to increase and currently stands around 66% after the latest, sharp sell-off in the rest of the cryptocurrency market. No other alt-coins has a market cap in double-figures with Ethereum (ETH) having a market dominance of 9.24% ahead of third-placed Ripple (XRP) with 4.56%, according to data from CoinMarketCap.
{9}
Bitcoin Market Dominance – One Year Chart
比特币市场ominance - 一年图表

Disclaimer:
The views in this article only represent the author's personal views, and do not constitute investment advice on this platform. This platform does not guarantee the accuracy, completeness and timeliness of the information in the article, and will not be liable for any loss caused by the use of or reliance on the information in the article.
Read more

Bitcoin and Ethereum See Strong Recovery
BTC crossed $57,000 while Ethereum jumped by more than 7%.

Crypto startup MoonPay raises $555M to hit $3.4B valuation
Launched in 2019, MoonPay says it has processed more than $2 billion in transactions and hit 7 million users so far.

Analysts pinpoint bull and bear scenarios as Bitcoin price dips below $56K
BTC price dropped below $56,000 again, leading analysts to discuss various bull and bear scenarios for Bitcoin’s short term price action.

Bitcoin Rises Again as Altcoins Outperform
Bitcoin is recovering from a weekend dip as traders anticipate the third U.S. futures-focused bitcoin exchange-traded fund (ETF) listing.
WikiFX Broker
Latest News
Exposing the Top 5 Scam Brokers of March 2025: A Closer Look by WikiFX
Gold Prices Climb Again – Have Investors Seized the Opportunity?
Webull Launches SMSF Investment Platform with Zero Fees
Australian Regulator Warns of Money Laundering and Fraud Risks in Crypto ATMs
The Withdrawal Trap: How Scam Brokers Lure Victims into Paying More
FCA to Investors: Think Twice Before Trusting These Brokers
Trump\s tariffs: How could they affect the UK and your money
Trump gambles it all on global tariffs he\s wanted for decades
HTFX Spreads Joy During Eid Charity Event in Jakarta
How Will the Market React at a Crucial Turning Point?
Currency Calculator


