简体中文
繁體中文
English
Pусский
日本語
ภาษาไทย
Tiếng Việt
Bahasa Indonesia
Español
हिन्दी
Filippiiniläinen
Français
Deutsch
Português
Türkçe
한국어
العربية
Gold Prices Eye Key Resistance, Silver Prices Outperforming Gold
Abstract:Gold Prices Eye Key Resistance, Silver Prices Outperforming Gold
Gold & Silver Price Analysis and Talking Points:
Gold Prices Focus on Pivotal Resistance
Silver Price Outlook | Outperforming Gold as Prices Eye Key Resistance
See our quarterly gold forecast to learn what will drive prices throughout Q3!
Gold Prices Focus on Pivotal Resistance
Gold prices have managed to consolidate above the $1400 as slowing Chinese growth provides yet another reminder of the deteriorating economic outlook. Overnight, Chinese Q2 GDP fell to 6.2% from 6.4%, marking the weakest quarterly growth since 1992. However, while gold prices pulled off its lows of the day since the release, the precious metal remains contained, given that weaker Chinese data raises the scope for fresh stimulus. Alongside this, the rest of the data had been relatively firm with both retail sales and industrial output beating analyst estimates, which in turn, suggests that the stimulus that the government has already provided is potentially having a positive impact going into the second half of the year. Going forward, with little on the economic calendar, focus will turn towards Feds Williams, who is a voter this year.
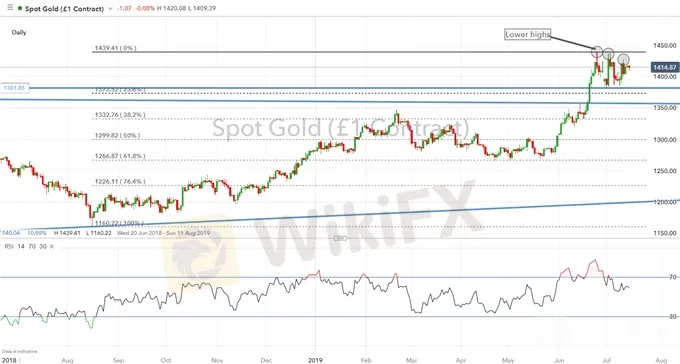
On the technical front, technical resistance remains pivotal for the precious metal. Given the series of lower highs and with the weekly time frame showing the RSI hovering in overbought territory, there is a risk of a slight pullback. Although, any pullbacks are likely to be well supported amid the backdrop of slowing global growth coupled with the Fed looking to ease monetary policy.
GOLD Technical Levels
Resistance 2: $1435-40 (Double-Top)
Support 1: $1380 (July low)
Support 2: $1373 (23.6% Fib)
GOLD PRICE CHART: Daily Time-Frame (Aug 2018 -Jul 2019)

What You Need to Know About the Gold Market
Silver Price Outlook | Outperforming Gold as Prices Eye Key Resistance
Silver prices have continued to edge higher since finding support at the psychological $15 level, which is now eyeing key resistance in the form of the 38.2% Fib level at $15.33. Last week, we had highlighted that the surge in ETF buying of silver bolds well for the outlook, while at the same time we continue to expect silver to outperform gold on a pullback in the gold/silver ratio which hovers around a 20yr high.
Silver Price Chart: Daily Timeframe (Oct 2018 – Jul 2019)

GOLD TRADING RESOURCES:
See our quarterly gold forecast to learn what will drive prices through mid-year!
Just getting started? See our beginners guide for FX traders
Having trouble with your strategy? Heres the #1 mistake that traders make
Disclaimer:
The views in this article only represent the author's personal views, and do not constitute investment advice on this platform. This platform does not guarantee the accuracy, completeness and timeliness of the information in the article, and will not be liable for any loss caused by the use of or reliance on the information in the article.
Read more

Weekly Economic Calendar: Key Events Impacting USD, JPY, GBP, EUR, and Gold (XAU)
This week's economic calendar is packed with key events affecting USD, JPY, GBP, EUR, and Gold (XAU). In the USA, watch for Core PCE Price Index, ISM Manufacturing PMI, Initial Jobless Claims, and JOLTs Job Openings. Japan releases the Tankan Large Manufacturers Index and Services PMI. The UK focuses on Manufacturing and Construction PMI, while the Eurozone releases CPI and Services PMI data. Each event's potential impacts on currencies and gold are analyzed for market insights.

GOLD TRADING ANALYSIS
Gold is expected to trade at 1866.03 USD/t oz

Gold Price Forecast: Bullion May Rise Further on Rising Inflation, Breakeven Rates
GOLD, XAU/USD, INFLATION, TREASURY YIELDS, BREAKEVEN RATES– TALKING POINT

Silver Price Outlook: XAG/USD Breakout Testing Uptrend Resistance
Silver prices surged nearly 30% off the May lows with the rally now probing critical resistance. Here are the levels that matter on the XAG/USD weekly chart.
WikiFX Broker
Latest News
Germany's Election: Immigration, Economy & Political Tensions Take Centre Stage
WikiFX Review: Is IVY Markets Reliable?
ATFX Enhances Trading Platform with BlackArrow Integration
Brazilian Man Charged in $290 Million Crypto Ponzi Scheme Affecting 126,000 Investors
IG 2025 Most Comprehensive Review
Construction Datuk Director Loses RM26.6 Mil to UVKXE Crypto Scam
SEC Drops Coinbase Lawsuit, Signals Crypto Policy Shift
Should You Choose Rock-West or Avoid it?
Franklin Templeton Submitted S-1 Filing for Spot Solana ETF to the SEC on February 21
Scam Couple behind NECCORPO Arrested by Thai Authorities
Currency Calculator


