简体中文
繁體中文
English
Pусский
日本語
ภาษาไทย
Tiếng Việt
Bahasa Indonesia
Español
हिन्दी
Filippiiniläinen
Français
Deutsch
Português
Türkçe
한국어
العربية
Gold Price Outlook: Support Holds, FOMC-Fuelled Breakout Looms
Abstract:The daily gold price chart shows the recent uptrend support line holding firm while resistance now looks increasingly vulnerable. Will the FOMC break the impasse?
Gold (XAU) Price Outlook, Analysis and Chart
Gold coiled and ready to breakout.
FOMC the likely trigger.
Q3 2019 Gold Forecast and Top Trading Opportunities
Gold Readies to Break Higher if FOMC Accommodative
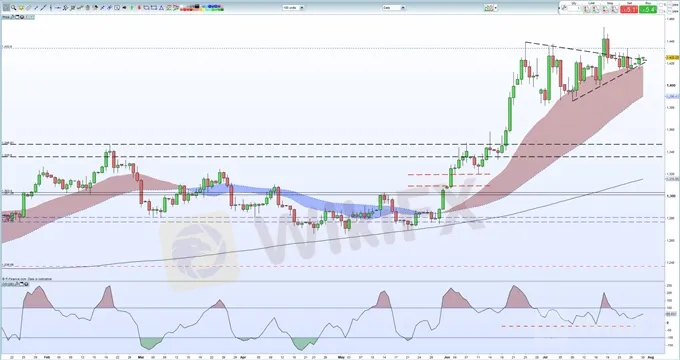
The daily gold price chart continues to show the precious metal trapped in a symmetrical triangle pattern with a breakout imminent, just one day before the FOMC meeting. Gold has been biding its time, and trading in a narrowing range, ahead of the Fed rate decision where the central bank is fully expected to cut interest rates by 0.25%, while expectations grow that a 0.50% cut may well happen. The price of gold moves higher when US interest rates move lower.
Live Coverage of the FOMC Rate Decision – Register Here.
A clean break, and close, above resistance will open the way to re-test the June 25 high at $1,439.4/oz. before the July 18 high at $1,453.0/oz. If we trade above this high, then gold will be back at levels not seen since May 2013. Downside protection at $1,411.0/oz. ahead of $1,400/oz. and $1,386/oz. Gold remains above all three moving averages, including the important 200-day ma, while the CCI indicator remains supported and looks set to move higher again.
200-Day Moving Average: What it is and How it Works.
The DailyFX Calendar covers all important market moving data releases and events.
Gold Price Daily Chart (January – July 30, 2019)

IG Client Sentiment data show that 69.8% of retail traders are net-long of gold, a bearish contrarian indicator. However, recent daily and weekly positional changes give us a stronger bearish contrarian bias.
Disclaimer:
The views in this article only represent the author's personal views, and do not constitute investment advice on this platform. This platform does not guarantee the accuracy, completeness and timeliness of the information in the article, and will not be liable for any loss caused by the use of or reliance on the information in the article.
Read more

The U.S. dollar index and U.S. Treasury yields rebounded at the same time; gold fell by more than 1%!
The initial value of the US S&P Global Manufacturing PMI in August was 48, which was lower than expected and the lowest in 8 months; the service PMI was 55.2, which exceeded the expected 54. The number of initial jobless claims in the week ending August 17 was 232,000, slightly higher than expected, and the previous value was revised from 227,000 to 228,000. Existing home sales in July increased for the first time in five months. The PMI data was lower than expected, which was bad for the US eco

KVB Market Analysis | 16 August: USD/JPY Forecast: Short-Term Bearish Trend Amid Dollar Consolidation
This year's arbitrage gains have been erased, with 65%-75% of these positions closed. The dollar's reaction has been as expected but slightly disappointing, with a significant 100 basis point rise in U.S. short-term interest rates impacting it. JPMorgan has reduced its dollar forecasts, now predicting USD/JPY at $146 in Q4 2024 and $144 in Q2 2025, down from $147. Despite a weakening job market, other economic data remains strong.

The U.S. dollar index returned to the 103 mark; gold once plunged nearly $40 from its intraday high!
The monthly rate of retail sales in the United States in July was 1%, far exceeding expectations; the number of initial claims last week was slightly lower than expected, falling to the lowest level since July; traders cut their expectations of a rate cut by the Federal Reserve, and interest rate futures priced that the Federal Reserve would reduce the rate cut to 93 basis points this year. The probability of a 50 basis point rate cut in September fell to 27%. The data broke the expectation of a

Gold Price Stimulates by Geopolitical Tension
Gold prices experienced their largest gain in three weeks, driven by escalating tensions in the Middle East and the easing of the U.S. dollar as markets await the crucial CPI reading due on Wednesday. Gold has surged to an all-time high above $2,460, as uncertainties surrounding developments in both the Middle East and Eastern Europe persist push the demand for safe-haven assets higher.
WikiFX Broker
Latest News
Top Regulated Forex Brokers with Prop Trading Options
Forex Regulators Around the World: Who’s the Strictest?
What Happens When a Broker Goes Bankrupt?
Why More Traders Are Turning to Proprietary Firms for Success
Unlocking the Secrets of Prop Trading: How to Succeed in Proprietary Trading Firms
Tether’s $13B Profits in 2024 Amid UK Regulatory Scrutiny
Philippine Authorities Bust Manila Online Scam Farm, Arrest 100
Indian Budget 2025-26: What's New for Cryptocurrency?
Success and Failure Lie in Leverage
What the Movie Margin Call Taught Traders About Risk and Timing
Currency Calculator


