简体中文
繁體中文
English
Pусский
日本語
ภาษาไทย
Tiếng Việt
Bahasa Indonesia
Español
हिन्दी
Filippiiniläinen
Français
Deutsch
Português
Türkçe
한국어
العربية
US Dollar Technical Outlook in EUR/USD, GBP/USD, USD/CHF, USD/CAD
Abstract:After a burst of excitement FX markets have begun to digest, but will sellers be able to provoke a bigger push in the US Dollar?
US Dollar Technical Outlook:
美元技术展望:
After a rush of excitement, digestion is back across a number of major FX pairs.
在一阵兴奋之后,消化又回来了主要外汇对的数量。
The US Dollar ran into resistance yesterday but as yet, buyers havent let up as a series of short-term higher-lows has shown below recent price action.
美元昨日遇阻,但到目前为止,买家尚未放松一系列短线低点已经显示在近期的价格走势之下。
US Dollar Digestion After Trendline Support
趋势线支持后的美元消化 p>
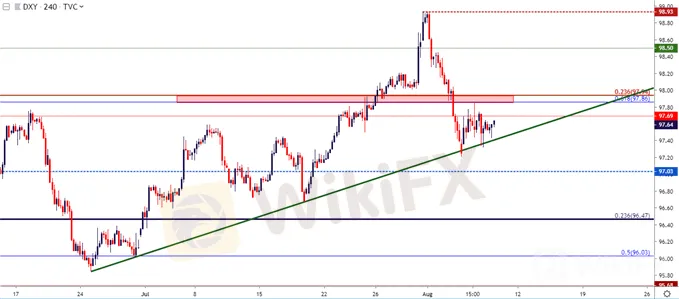
The US Dollar is continuing to show digestion following the Monday bounce. As looked at yesterday, that bounce ran up to a zone of Fibonacci levels that runs from 97.86-97.94, and that area has since helped to hold the highs. But, sellers havent exactly been able to take advantage of that at this point as a series of higher-lows remains under near-term price action of the US Dollar. Those higher-lows are getting an assist from a trendline produced by swing-lows in June and mid-July.
美元在周一反弹后继续显示消化。从昨天看,该反弹上升至斐波那契水平区域,从97.86-97.94开始,该区域已经帮助维持高位。但是,由于一系列较高的低点仍处于美元的近期价格走势之下,卖家目前还没能完全利用这一点。这些较高的低点是从6月和7月中旬的低点产生的趋势线获得帮助。
US Dollar Four-Hour Price Chart
美元四小时价格图表

Chart prepared by James Stanley; US Dollar on Tradingview
James Stanley编制的图表; Tradingview上的美元
EUR/USD Holds at Confluent Resistance Zone
欧元/美元位于汇合阻力区
Going along with that near-term congestion in USD has been a similar theme playing out in the Euro. EUR/USD started the week by spiking up to a resistance zone around the 1.1250 level. That zone helped to moderate the advance and since then prices have been digesting within a key zone on the chart, spanning from 1.1187-1.1212. This zone has been in-play in various ways since November of last year, and this highlights a tug-of-war over the past few days.
伴随着美元的近期拥挤一直存在一个类似的主题在欧元区播出。本周开始欧元/美元飙升至1.1250附近的阻力位。该区域有助于缓和涨势,此后价格在图表的关键区域消化,从1.1187-1.1212开始。自拉斯维加斯11月以来,该区域已经以各种方式发挥作用一年,这突显了过去几天的拉锯战。
On shorter-term variations, higher-lows within this zone can keep the door open for near-term bullish strategies.
关于短期变化,更高的低点在这个区域内可以为近期看涨策略敞开大门。
EUR/USD Two-Hour Price Chart
欧元/美元两小时价格走势图

Chart prepared by James Stanley; EURUSD on Tradingview
James Stanley编制的图表;关于Tradingview的EURUSD
On a longer-term basis, however, a hold of this zone can keep the door open for bearish swing strategies. Given that lack of directional pull in recent USD price action, this appears to be a pick-your-poison type of operation. For those defaulting to fundamental biases, the short-side is likely more attractive as the ECB has, at the very least, talked up future loosening. The Fed at this point hasnt opined much on the matter.
然而,从长期来看,持有该区域可以为看跌摆动策略敞开大门。鉴于近期美元价格行动缺乏定向拉动,这似乎是一种挑剔的毒性操作。对于那些违背基本面偏见的人来说,短边可能更具吸引力,因为欧洲央行至少谈到了未来的放松。此时美联储对此事并未提及太多。
EUR/USD Daily Price Chart
欧元/美元每日价格走势图

Chart prepared by James Stanley; EURUSD on Tradingview
James Stanley编制的图表; Tradingview上的EURUSD
GBP/USD Builds Range After Long-Term Trendline
英镑/美元在长期趋势线后构建区间
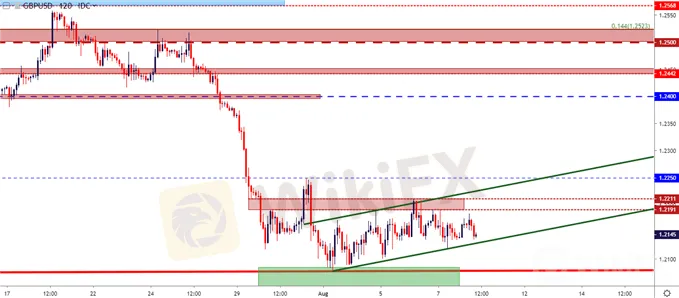
After the excitement in the British Pound through the month of July one might be surprised at the seeming lack of volatility in GBP/USD so far in August. But after a long-term trendline came into play last week, sellers haven‘t been able to make much ground. Prices quickly reverted back to resistance at 1.2191-1.2211, and this has helped the pair to build in a mild range over the past five trading days. This becomes an item of interest for USD bulls, as the continued show by Cable sellers may be preluding a large break-lower should USD strength show back-up. On the two-hour chart below, a short-term bear flag formation shows after last week’s bounce at trendline support.
在英镑到月之后的兴奋之后7月份可能会对8月份英镑/美元似乎缺乏波动感到惊讶。但在上周长期趋势线发挥作用后,卖家未能取得多大进展。价格迅速恢复到阻力位1.2191-1.2211,这有助于该货币对在过去五个交易日内构成温和区间。这成为美元多头的一个利息项目,因为有线电视卖家的持续表现可能会在美元走强的情况下出现大幅下跌。在下面的两小时图表中,短线熊市标志形成显示在上周在趋势线支撑位反弹之后。
GBP/USD Two-Hour Price Chart
英镑/美元两小时价格图表

Chart prepared by James Stanley; GBPUSD on Tradingview
图表由James Stanley编写; Tradingview上的英镑兑美元
Taking a step back, and that long-term trendline comes from the pre-Plaza Accord low which connects with the flash crash lows from October of 2016. If this trend-line gives way, the next obvious level of support is the 1.2000 psychological level, after which the 1.1950 flash crash low comes in to view. But – after that? Its a vacuum of price action and prices could drop precipitously.
退一步,长期趋势线来自广场雅阁前低点,与2016年10月的闪电崩盘低点相关。如果这一趋势-line让位,下一个明显的支持水平是1.2000心理水平,之后1.1950的闪电崩盘低点进入观察。但是 - 之后呢?它是价格行动的真空,价格可能急剧下跌。
GBP/USD Monthly Price Chart
英镑/美元月度价格图表

Chart prepared by James Stanley; GBPUSD on Tradingview
James Stanley编制的图表; Tradingview上的英镑兑美元
USD/CHF Grasps on to 2019 Lows
美元/瑞士法郎在2019年低点后的掌握
Getting away from the two more popular major pairs to look at USD/CHF, last week‘s precipitous drop finally found support around the 2019 lows, taking place around the .9700 level on the chart. Yesterday saw this level get tested through but sellers couldn’t make much ground, as this was followed by an aggressive bounce right back-above the .9750 level. This can keep the door open for a deeper bounce, looking to prior support levels around .9800 or .9850 for that next level of lower-high resistance.
远离两个更受欢迎的主要货币对看美元/瑞士法郎,上周的急剧下跌终于在2019年的低点附近获得支撑,位于图表上的.9700附近。昨天看到这个水平得到了测试,但是卖家无法做多,因为接下来是积极的反弹回到-9750水平之上。这可以使门保持开启状态以获得更深的反弹,并且可以看到先前支撑位在.9800或.9850附近的下一个高位阻力位。
USD/CHF Daily Price Chart
美元/瑞士法郎每日价格图表

Chart prepared by James Stanley; USDCHF on Tradingview
图表由James Stanley编写;美元兑换在交易视图上
USD/CAD: Has a Top Been Set?
美元/加元:有一个最高位置?
The bullish reversal in USD/CAD has ran pretty clean over the past few weeks. My final target on the setup was the 1.3250-1.3300 zone but, that hasn‘t yet stopped the advance as buyers are showing higher-low support around this price this morning. But, we may be near a catch point given the pullback that showed yesterday, and there’s another zone of resistance sitting just ahead that could begin to help built swing setups. This runs from 1.3361-1.3385; and if this near-term theme of strength is going to extend, that becomes the next area to look to for resistance. If this bullish run doesnt extend, looking for a break back-below 1.3250 could re-open the door for short-side scenarios in the pair.
美元/加元的看涨逆转已经非常干净在过去的几周里。我在设置上的最终目标在1.3250-1.3300区域,但由于今天早上买家在这个价位附近显示出更低的支撑位,因此尚未停止上涨。但是,考虑到昨天出现的回调,我们可能接近一个接近点,并且还有另一个阻力区位于前方,可以开始帮助建立摆动设置。从1.3361-1.3385开始;如果这个近期的力量主题将延伸,那将成为下一个寻求抵抗的领域。如果这个看涨行情没有扩大,那么寻找突破回落至1.3250下方可能会重新打开该货币对中的短边情景。
USD/CAD Four-Hour Price Chart
美元/加元四小时价格图表

Chart prepared by James Stanley; USDCAD on Tradingview
图表由James Stanley编写; Tradeview上的USDCAD
Disclaimer:
The views in this article only represent the author's personal views, and do not constitute investment advice on this platform. This platform does not guarantee the accuracy, completeness and timeliness of the information in the article, and will not be liable for any loss caused by the use of or reliance on the information in the article.
Read more

FBS Joins Two Prestigious Financial Events by the End of 2024
FBS is thrilled to announce our participation in two major financial events in Asia – iFX Expo Asia 2024 and Traders Fair Davao!

FBS IB Program Named the Best Globally
The FBS Partnership Program earned the title of the Best Introducing Broker Programme 2024 from the World Finance Awards.

FBS Ranked Among Top 5 Best Brokers by FXStreet
FBS has been recognized as one of the best Forex brokers in 2024 by FXStreet!

FBS Increases Leverage on U.S. Indices to 1:500
FBS is excited to announce a significant update in trading conditions for our clients: starting from August 5th, 2024, the leverage on major U.S. indices, including US30, US100, and US500, is increased from 1:200 to 1:500.
WikiFX Broker
Latest News
The Withdrawal Trap: How Scam Brokers Lure Victims into Paying More
FCA to Investors: Think Twice Before Trusting These Brokers
Trump\s tariffs: How could they affect the UK and your money
Trump gambles it all on global tariffs he\s wanted for decades
TradingView Brings Live Market Charts to Telegram Users with New Mini App
Trump tariffs: How will India navigate a world on the brink of a trade war?
Interactive Brokers Launches Forecast Contracts in Canada for Market Predictions
Authorities Alert: MAS Impersonation Scam Hits Singapore
IG Group Acquires Freetrade for £160M to Expand UK Investment Market
U.S. March ISM Manufacturing PMI Released
Currency Calculator


