简体中文
繁體中文
English
Pусский
日本語
ภาษาไทย
Tiếng Việt
Bahasa Indonesia
Español
हिन्दी
Filippiiniläinen
Français
Deutsch
Português
Türkçe
한국어
العربية
Oil Price Targets: Crude Recovery Eyes August Highs– WTI Trade Levels
Abstract:Oil prices have surged nearly 5% this week with the advance now targeting downtrend resistance. Here are the trade levels that matter on the WTI weekly chart.
Oil prices up nearly 5% since the start of the week- rally targeting slope resistance just higher
Check out our 2019 projections in our Free DailyFX Oil Price Trading Forecasts
Join Michael for Live Weekly Strategy Webinars on Mondays at 12:30GMT
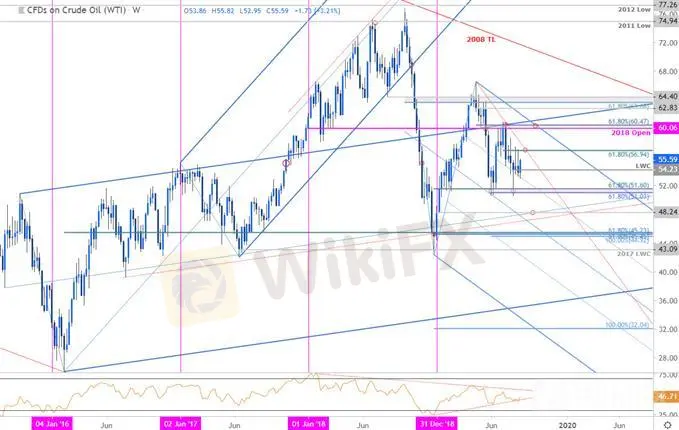
Oil prices have continued to rebound off downtrend support for the past three weeks with the near-term recovery now approaching multi-month trendline resistance just higher. These are the updated targets and invalidation levels that matter on the oil weekly price chart (WTI). Review my latestWeekly Strategy Webinar for an in-depth breakdown of this US Dollar trade setup and more.
New to Oil Trading? Get started with this Free How to Trade Crude Oil Beginners Guide
Oil Price Chart – WTI Weekly

Notes: In my last Oil Price Weekly Outlook we noted that crude had rebounded from key support around 51.03/60 with, “initial resistance eyed at the April trendline.” More than two-weeks later and WTI prices have continued to hold a range just below this slope as weekly RSI tightens into the apex of a broader consolidation extending off last year‘s momentum high. Note that the 38.2% parallel of the descending pitchfork formation we’ve been tracking off the yearly high has continued to govern the lows of for the past three-weeks.
Initial resistance now stands at the 61.8% retracement of the July decline at 56.94 with a breach above the April trendline needed to suggest a larger recovery is underway. Critical resistance / broader bearish invalidation steady at 60.06/47. Look for soft support at the monthly low-week close at 54.23 backed by low-day close at 52.29. Ultimately a break /close below key support at 51.03/60 is needed to mark resumption of the broader downtrend targeting 48.24.
For a complete breakdown of Michaels trading strategy, review his Foundations of Technical Analysis series on Building a Trading Strategy
Bottom line: Oil prices are rebounding off down-trend support with the advance once again approaching the April trendline. From at trading standpoint, look to reduce long-exposure / raise protective stops on a stretch towards 56.94 – look for a reaction there IF reached (area of interest for possible topside exhaustion). Ultimately, a breakout of the 51-57 range / RSI consolidation zone is needed to offer guidance on the medium-term directional bias. Ill publish an updated Crude Oil Price Outlook once we get further clarity in near-term price action.
Crude Oil Trader Sentiment

A summary of IG Client Sentiment shows traders are net-long Oil - the ratio stands at +1.08 (52% of traders are long) – neutral reading
Traders have remained net-long since August 13th; price has moved 0.4% lower since then
Long positions are 22.4% lower than yesterday and 0.5% higher from last week
Short positions are 34.4% higher than yesterday and 0.4% lower from last week
We typically take a contrarian view to crowd sentiment, and the fact traders are net-long suggests Oil - US Crude prices may continue to fall. Positioning is less net-long than yesterday but more net-long from last week and the combination of current positioning and recent changes gives us a further mixed Oil price trading bias from a sentiment standpoint.
See how shifts in Crude Oil retail positioning are impacting trend- Learn more about sentiment!
---
Previous Weekly Technical Charts
Sterling (GBP/USD)
Gold (XAU/USD)
Canadian Dollar (USD/CAD)
US Dollar (DXY)
Aussie (AUD/USD)
Disclaimer:
The views in this article only represent the author's personal views, and do not constitute investment advice on this platform. This platform does not guarantee the accuracy, completeness and timeliness of the information in the article, and will not be liable for any loss caused by the use of or reliance on the information in the article.
Read more

Upbeat U.S. GDP Spurs Dollar Strength
The U.S. GDP released yesterday surpassed market expectations, which has tempered some speculation about a Fed rate cut and spurs dollar's strength.

Oil Price Soar on Geopolitical Tension
Geopolitical tensions in both the Middle East and Eastern Europe have escalated, oil prices surged nearly 3% in yesterday's session. creating significant unease in the broader financial markets.

KVB Market Analysis | 27 August: AUD/USD Holds Below Seven-Month High Amid Divergent Central Bank Policies
The Australian Dollar (AUD) traded sideways against the US Dollar (USD) on Tuesday, staying just below the seven-month high of 0.6798 reached on Monday. The downside for the AUD/USD pair is expected to be limited due to differing policy outlooks between the Reserve Bank of Australia (RBA) and the US Federal Reserve. The RBA Minutes indicated that a rate cut is unlikely soon, and Governor Michele Bullock affirmed the central bank's readiness to raise rates again if necessary to combat inflation.

BoJ Holds Firm on Tightening Path Fuels Yen
The Bank of Japan (BoJ) remains on course with its monetary tightening policy, according to the BoJ Chief, following his hearing at the Japan Lower House.
WikiFX Broker
Latest News
Will Gold Prices Continue to Rise Due to Trump’s Tariffs?
Miami Firm Owner Pleads Guilty to $6M Ponzi Scheme Fraud
eToro Files for IPO with $5 Billion Valuation on NASDAQ
NBI Cebu Arrests Forex Trader for Illegal Investment Solicitation
PU Prime's "Feather Your Trades" Contest! Begin
Is FizmoFX a Scam? Fraud and Account Suspension of Traders
IG Japan Extends US Stock CFD Trading Hours in 2025
Which Zodiac Sign Makes the Best Trader?
ALERT! Warning against Livaxxen
Vanguard Settles $106M SEC Case Over Misleading Investors
Currency Calculator


