简体中文
繁體中文
English
Pусский
日本語
ภาษาไทย
Tiếng Việt
Bahasa Indonesia
Español
हिन्दी
Filippiiniläinen
Français
Deutsch
Português
Türkçe
한국어
العربية
Setback in WTI May Lead a Breach Below $30
Abstract:On Tuesday, the Wall Street equity indices further declined with the Nasdaq losing 4.11% to 10,847.69. Consequently, WTI crude posted its worst day in nearly three months, falling sharply to an intraday low of $36.12 from the level above $39.0.
WikiFX News (9 Sept) - On Tuesday, the Wall Street equity indices further declined with the Nasdaq losing 4.11% to 10,847.69. Consequently, WTI crude posted its worst day in nearly three months, falling sharply to an intraday low of $36.12 from the level above $39.0.
According to Baker Hughes, a US energy services firm, the changes in the economy and behaviors brought about by the outbreak would hamper the demand for oil and gas. The firm predicted that global activities of oil services would be lower in 2021, compared with that in 2020. Undoubtedly, the main reason driving the rapid decrease in oil prices is the bearish global demand for oil.
More seriously, OPEC+ members are still set to cut production gradually even the outlook for the global oil demand side is worsening, which seems to be the main driver spurring markets to go short on oil. Previously, crude oil has sent a signal of downside as Saudi Arabia has cut prices for Asia and the United States twice in a row. Therefore, questions have been raised on Saudi Arabia and Russia about their resolve to stabilize oil prices as leaders of OPEC+.
As for investors, eyes may turn to China's CPI y/y rate of change in August as well as API's weekly crude inventories to be released early this Thursday, which is expected to affect oil prices.
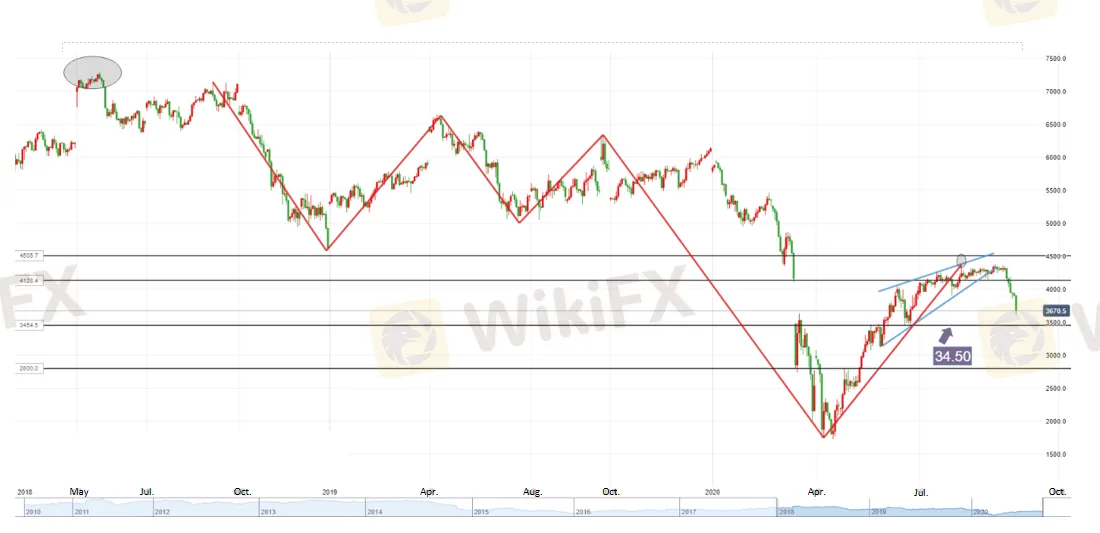
According to the daily chart, oil prices have approached around $34.50 with high possibility to gain some support in this area. From the long-term view, oil prices may tend to test the support below $30 in the medium term after suffering a slump from the price war between Saudi Arabia and Russia.
All the above is provided by WikiFX, a platform world-renowned for foreign exchange information. For details, please download the WikiFX App:
bit.ly/WIKIFX

Chart: Trend of WTI Crude
Disclaimer:
The views in this article only represent the author's personal views, and do not constitute investment advice on this platform. This platform does not guarantee the accuracy, completeness and timeliness of the information in the article, and will not be liable for any loss caused by the use of or reliance on the information in the article.
Read more

GEMFOREX - weekly analysis
The week ahead: Top 5 things to watch

GemForex | Crude Oil (WTI)
Crude Oil (WTI) - Rebound in the offing?

WTI hits fresh cycle highs in the mid-$63.00s
WTI hits fresh cycle highs in the mid-$63.00s

WTI Breaks Below $41.0 As EIA Cuts Demand Forecast
On Thursday, WTI saw its rally just shy of the intraday high of $42.18 and witnessed choppy downsides before breaching below the support at $41.0 to the intraday low of $40.61, notching two consecutive days of drops.
WikiFX Broker
Latest News
TradingView Brings Live Market Charts to Telegram Users with New Mini App
Trump tariffs: How will India navigate a world on the brink of a trade war?
Interactive Brokers Launches Forecast Contracts in Canada for Market Predictions
Authorities Alert: MAS Impersonation Scam Hits Singapore
Stocks fall again as Trump tariff jitters continue
INFINOX Partners with Acelerador Racing for Porsche Cup Brazil 2025
Regulatory Failures Lead to $150,000 Fine for Thurston Springer
April Forex Trends: EUR/USD, GBP/USD, USD/JPY, AUD/USD, USD/CAD Insights
March Oil Production Declines: How Is the Market Reacting?
Georgia Man Charged in Danbury Kidnapping and Crypto Extortion Plot
Currency Calculator


