简体中文
繁體中文
English
Pусский
日本語
ภาษาไทย
Tiếng Việt
Bahasa Indonesia
Español
हिन्दी
Filippiiniläinen
Français
Deutsch
Português
Türkçe
한국어
العربية
Technical Analysis: USD Weakness Against EUR and Major Pivot Points
Sommario:Updated forex analysis shows USD weakness, focusing on key levels like EUR/USD, DXY bearish trend, and pivot points for major currency pairs.

As of the technical analysis update dated September 27, 2024, the USD continues to show signs of weakness, especially against the Euro and other major currencies. Traders and analysts worldwide are observing key pivot points and Fibonacci retracement levels to navigate market conditions, with a bearish outlook dominating many USD pairs. Here's a breakdown of the current situation for the US Dollar Index (DXY), EUR/USD, and several other major currency pairs.
DXY (US Dollar Index): Bearish Momentum Prevails
The US Dollar Index (DXY) has been trending downward, with overall momentum remaining bearish. Price action is currently hovering near the 101.37 pivot level, which serves as overlap resistance coupled with the 38.2% Fibonacci retracement. This combination suggests potential downside movement if the DXY fails to breach this resistance.

Should the index drop, the 1st support level at 100.24 could provide buying interest, though any recovery might face further resistance at 102.16, marked by a 61.8% Fibonacci retracement. Market participants should watch closely for reactions around these pivot points as they could signal the next leg of USD weakness.
EUR/USD: Testing Multi-Swing Resistance
EUR/USD continues to be a focal point for many forex traders, especially with a bearish bias in play. Price action suggests a bearish reaction from the 1.1201 pivot, where multi-swing high resistance aligns. If the price follows this downward trend, the first support level at 1.1072, supported by a 61.8% Fibonacci retracement, is likely the next key area to watch.

However, should the Euro gain strength, resistance at 1.1273, backed by a 161.8% Fibonacci extension, could cap any bullish moves. Traders should consider these levels when planning their entry and exit points, as EUR/USD volatility may intensify around these key zones.
USD/JPY: Bullish Continuation Potential
Contrary to the bearish momentum seen in the DXY and EUR/USD pairs, USD/JPY is showing signs of bullish continuation. The pair is trading near the 144.32 pivot level, which serves as a strong overlap support. If the price maintains this level, it could rise towards the 1st resistance at 146.68, driven by pullback resistance and a 78.6% Fibonacci projection.

This bullish outlook may attract investors seeking opportunities in stronger dollar pairs as the yen remains under pressure in broader market conditions. Keep an eye on support at 142.81 for any pullbacks before a potential continuation.
GBP/USD: Resistance Testing in Bearish Environment
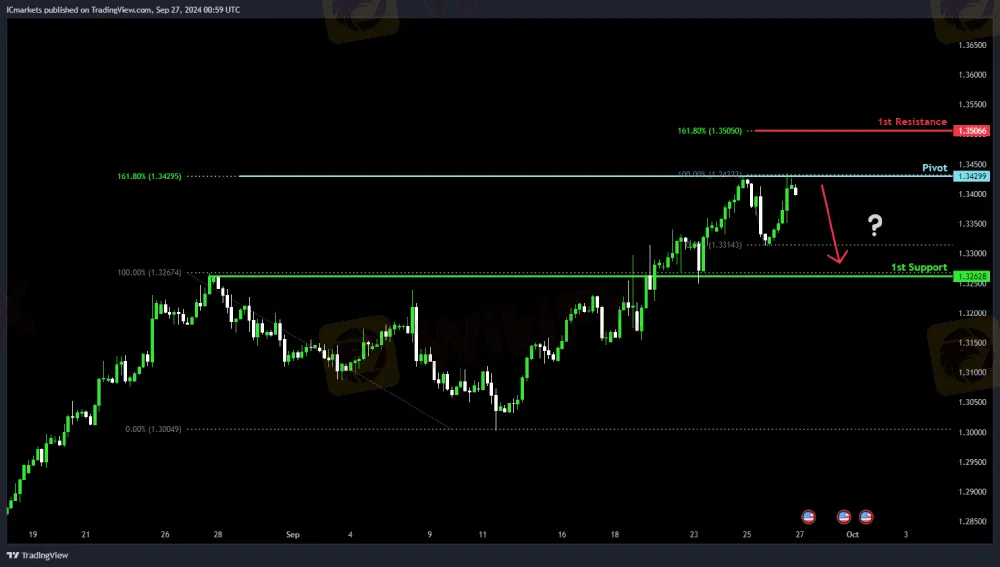
GBP/USD is currently displaying a bearish bias, with price action testing the 1.3429 pivot. This level aligns with swing-high resistance and a significant 161.8% Fibonacci extension, marking it as a key hurdle for any potential upward move.

If the price continues to fall, the first support level at 1.3262 could offer a potential area for buyers to step in. However, any rally faces resistance at 1.3506, making it crucial for traders to monitor price behavior around these levels for clues on future price action.
Conclusion: USD Under Pressure Across Major Pairs
With the US Dollar Index reflecting bearish sentiment and several USD pairs testing key pivot points, the forex market remains highly sensitive to upcoming data and technical triggers. While USD/JPY presents a bullish case, the overall trend for the dollar is weak, particularly against the Euro and British Pound. Forex traders should remain vigilant, paying close attention to Fibonacci retracement levels and support/resistance zones to navigate this period of uncertainty.
By staying informed on pivot points and technical patterns, traders and investors can better align their strategies with the current market dynamics, optimizing for potential movements across USD-related forex pairs.
Track real-time market volatility with WikiFX's VPS-powered trading charts. Stay updated on key pivot points and Fibonacci levels. Visit the WikiFX market page now!

Disclaimer:
Le opinioni di questo articolo rappresentano solo le opinioni personali dell’autore e non costituiscono consulenza in materia di investimenti per questa piattaforma. La piattaforma non garantisce l’accuratezza, la completezza e la tempestività delle informazioni relative all’articolo, né è responsabile delle perdite causate dall’uso o dall’affidamento delle informazioni relative all’articolo.
WikiFX Trader
Tickmill
Octa
FP Markets
EC Markets
GO MARKETS
IC Markets Global
Tickmill
Octa
FP Markets
EC Markets
GO MARKETS
IC Markets Global
WikiFX Trader
Tickmill
Octa
FP Markets
EC Markets
GO MARKETS
IC Markets Global
Tickmill
Octa
FP Markets
EC Markets
GO MARKETS
IC Markets Global
Rate Calc


