简体中文
繁體中文
English
Pусский
日本語
ภาษาไทย
Tiếng Việt
Bahasa Indonesia
Español
हिन्दी
Filippiiniläinen
Français
Deutsch
Português
Türkçe
한국어
العربية
Japanese Yen Price Targets: USD/JPY Breakout Pending- Trade Levels
บทคัดย่อ:Price has set a well-defined weekly opening-range just below downtrend resistance and were looking for the break. Here are the levels that matter on the USD/JPY charts.
USD/JPY sets weekly opening-range below downtrend resistance- breakout pending
Check out our 2019 projections in our Free DailyFX USD/JPY Trading Forecasts
Join Michael for Live Weekly Strategy Webinars on Mondays at 12:30GMT
The Japanese Yen is down nearly 1% against the US Dollar this week with USD/JPY now testing near-term downtrend resistance. The immediate focus is on a break of a well-defined weekly opening range in price. These are the updated targets and invalidation levels that matter on the USD/JPY charts heading into the close of August trade. Review this week's Strategy Webinar for an in-depth breakdown of this silver price setup and more.
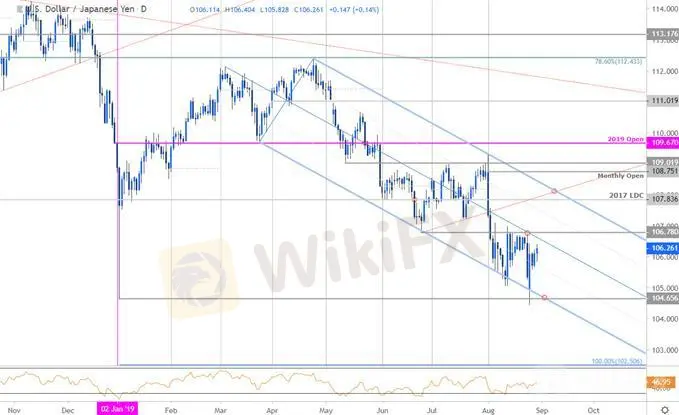
Yen Price Chart – USD/JPY Daily

Chart Prepared by Michael Boutros, Technical Strategist; USD/JPY on Tradingview
Technical Outlook: In last month‘s USD/JPY Price Outlook our ’bottom line‘ noted that we favored “fading a spike higher” as price was approaching downtrend resistance (109.42) at the upper parallel of the descending pitchfork formation we’ve been tracking off the yearly highs. USD/JPY registered a high at 109.31 into the start of the month before reversing sharply lower with the decline rebounding off parallel support this week.
Initial daily resistance stands with the median-line; a topside breach / close above the June lows at 106.78 is needed to suggest a more significant low was registered this week with such a scenario exposing the 75% parallel backed by the 2017 low-day close at 107.83. Key support rest with the lower parallel, which converges on the January lows at 104.65 – weakness beyond this threshold would likely see accelerated losses for the greenback targeting 103.48.
Yen Price Chart – USD/JPY 240min

Chart Prepared by Michael Boutros, Technical Strategist; USD/JPY on Tradingview
Notes: A closer look at Yen price action sees USD/JPY trading within a well-defined weekly opening-range just below the median-line. A topside breach exposes subsequent resistance objectives at the June low at 106.78 backed by the Fibonacci confluence at 107.45/48 (61.8% retracement of the August range / 38.2% retracement of the 2019 yearly range) – look for a bigger reaction there IF reached.
Initial support rests with the May ow at 105.55 backed by the weekly open at 104.97. Ultimately a break below the yearly swing low at 104.65 is needed to mark resumption of the broader downtrend.
For a complete breakdown of Michaels trading strategy, review his Foundations of Technical Analysis series on Building a Trading Strategy
Bottom line: USD/JPY has set a clean weekly opening range just below downtrend resistance and we‘re looking for the break for guidance on our near-term directional bias. From a trading standpoint, a good place to raise protective stops - we’re looking for a reaction here at the median-line. Ultimately a topside breach may offer more favorable short-entries closer to trend resistance. IF price fails here, look for a move below the May lows to validate a larger decline targeting the lower parallels. Review my latest Japanese Yen Weekly Price Outlook for a longer-term look at the technical picture for USD/JPY.
Japanese Yen Trader Sentiment – USD/JPY Price Chart

A summary of IG Client Sentiment shows traders are net-long USD/JPY - the ratio stands at +1.55 (60.7% of traders are long) – bearish reading
Traders have remained net-long since May 3rd; price has moved 4.9% lower since then
The percentage of traders net-long is now its lowest since July 29th
Long positions are 2.5% lower than yesterday and 3.7% lower from last week
Short positions are10.8% higher than yesterday and 15.7% higher from last week
We typically take a contrarian view to crowd sentiment, and the fact traders are net-long suggests USD/JPY prices may continue to fall. Yet traders are less net-long than yesterday & compared with last week and the recent changes in sentiment warn that the current USD/JPY price trend may soon reverse higher despite the fact traders remain net-long.
---
Key US / Japanese Data Releases

Economic Calendar - latest economic developments and upcoming event risk.
Active Trade Setups
Gold Price Targets: XAU/USD Breakout Losing Steam– Technical Outlook
Silver Price Targets: XAG Surges to Fresh Yearly Highs– Trade Levels
Sterling Price Targets: Pound Reversal Tests Initial GBP/USD Hurdles
S&P 500 Price Targets: SPX Consolidation Levels – Technical Trade Outlook
Canadian Dollar Price Targets: USD/CAD Bulls Eye Key Resistance Pivot
US Dollar Price Outlook: DXY Threatens Larger Recovery– Trade Targets
ข้อจำกัดความรับผิดชอบ:
มุมมองในบทความนี้แสดงถึงมุมมองส่วนตัวของผู้เขียนเท่านั้นและไม่ถือเป็นคำแนะนำในการลงทุน สำหรับแพลตฟอร์มนี้ไม่รับประกันความถูกต้องครบถ้วนและทันเวลาของข้อมูลบทความ และไม่รับผิดชอบต่อการสูญเสียใด ๆ ที่เกิดจากการใช้ข้อมูลในบทความ
WikiFX โบรกเกอร์
STARTRADER
XM
FOREX.com
EC Markets
TMGM
OANDA
STARTRADER
XM
FOREX.com
EC Markets
TMGM
OANDA
WikiFX โบรกเกอร์
STARTRADER
XM
FOREX.com
EC Markets
TMGM
OANDA
STARTRADER
XM
FOREX.com
EC Markets
TMGM
OANDA
ข่าวล่าสุด
10 บทเรียนที่เทรดเดอร์ต้องรู้จากปีที่ผ่านมา
วางแผนการเกษียณ ใช้ปีใหม่เป็นจุดเริ่มต้นความมั่งคั่ง
นี่คือ 3 ปัจจัยที่นักลงทุนต้องจับตาในปี 2025
เช็กให้ชัวร์! ตรวจสุขภาพการเงินก่อนเริ่มปีใหม่
"สรุปพอร์ตปีเก่า" วิเคราะห์กำไร-ขาดทุน เพื่อเตรียมแผนปีใหม่
ข้อคิดพิชิตการลงทุนจาก เทรดเดอร์สาวแถวหน้าของโลก
ศาลยกฟ้องคดีแชร์ Forex-3D ดีเจแมน – ใบเตย-แดริล
คำนวณอัตราแลกเปลี่ยน


